French American Indian vs Immigrants from Middle Africa Family Households
COMPARE
French American Indian
Immigrants from Middle Africa
Family Households
Family Households Comparison
French American Indians
Immigrants from Middle Africa
62.4%
FAMILY HOUSEHOLDS
0.0/ 100
METRIC RATING
297th/ 347
METRIC RANK
61.9%
FAMILY HOUSEHOLDS
0.0/ 100
METRIC RATING
316th/ 347
METRIC RANK
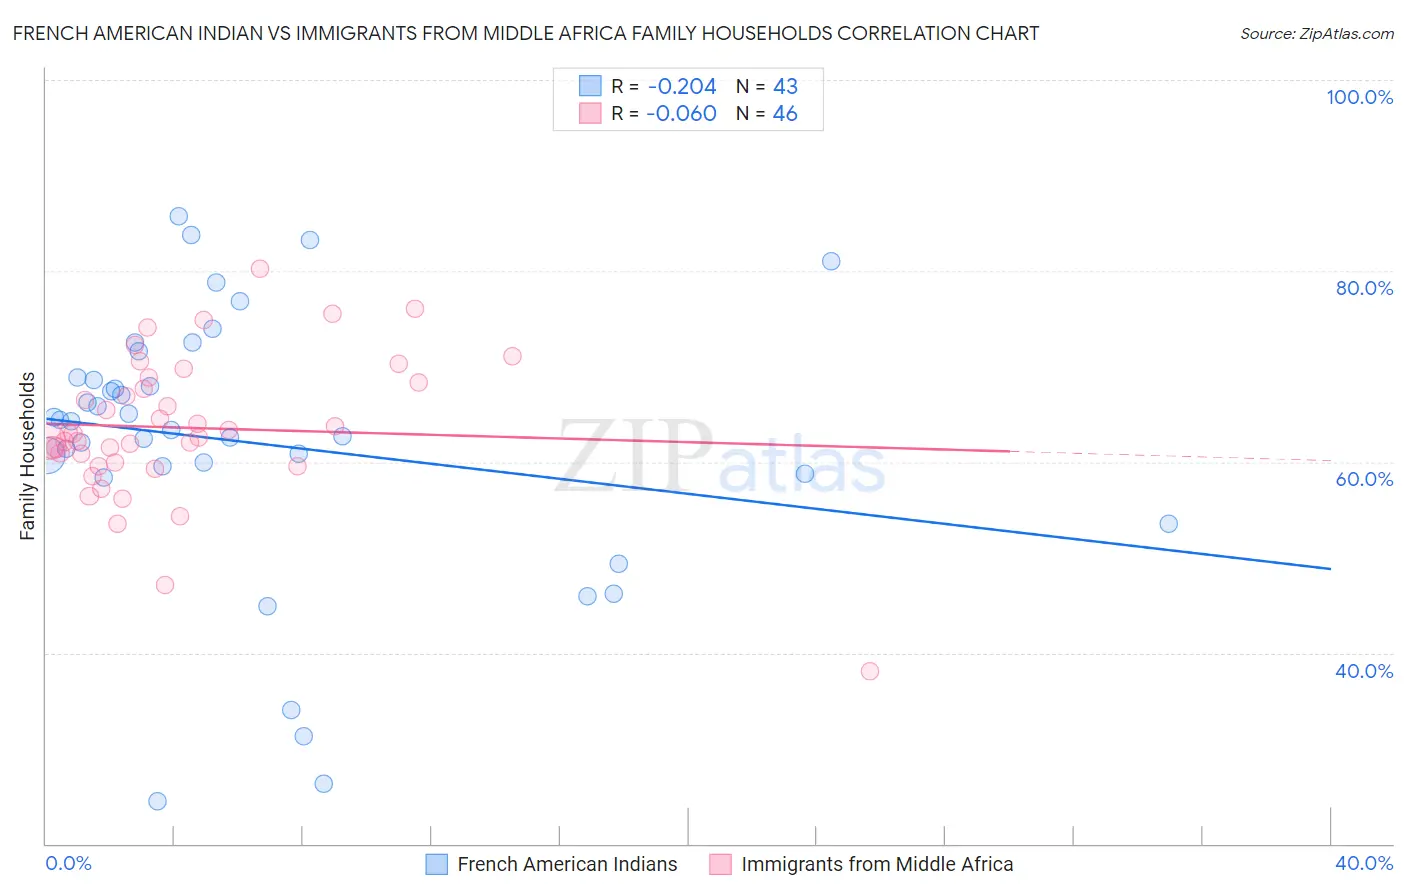
French American Indian vs Immigrants from Middle Africa Family Households Correlation Chart
The statistical analysis conducted on geographies consisting of 131,961,185 people shows a weak negative correlation between the proportion of French American Indians and percentage of family households in the United States with a correlation coefficient (R) of -0.204 and weighted average of 62.4%. Similarly, the statistical analysis conducted on geographies consisting of 202,657,833 people shows a slight negative correlation between the proportion of Immigrants from Middle Africa and percentage of family households in the United States with a correlation coefficient (R) of -0.060 and weighted average of 61.9%, a difference of 0.88%.
Family Households Correlation Summary
| Measurement | French American Indian | Immigrants from Middle Africa |
| Minimum | 24.4% | 38.1% |
| Maximum | 85.7% | 80.2% |
| Range | 61.3% | 42.1% |
| Mean | 62.0% | 63.6% |
| Median | 64.2% | 62.7% |
| Interquartile 25% (IQ1) | 58.8% | 60.0% |
| Interquartile 75% (IQ3) | 68.8% | 68.3% |
| Interquartile Range (IQR) | 10.1% | 8.4% |
| Standard Deviation (Sample) | 14.3% | 7.5% |
| Standard Deviation (Population) | 14.1% | 7.5% |
Demographics Similar to French American Indians and Immigrants from Middle Africa by Family Households
In terms of family households, the demographic groups most similar to French American Indians are Slovene (62.4%, a difference of 0.010%), Immigrants from Spain (62.4%, a difference of 0.030%), Immigrants from Kuwait (62.4%, a difference of 0.090%), Immigrants from Africa (62.4%, a difference of 0.090%), and Immigrants from Albania (62.4%, a difference of 0.11%). Similarly, the demographic groups most similar to Immigrants from Middle Africa are Moroccan (61.9%, a difference of 0.040%), Immigrants from Cabo Verde (61.9%, a difference of 0.080%), Liberian (62.0%, a difference of 0.13%), Immigrants from Latvia (62.0%, a difference of 0.14%), and Immigrants from Morocco (62.0%, a difference of 0.18%).
| Demographics | Rating | Rank | Family Households |
| Slovenes | 0.0 /100 | #296 | Tragic 62.4% |
| French American Indians | 0.0 /100 | #297 | Tragic 62.4% |
| Immigrants | Spain | 0.0 /100 | #298 | Tragic 62.4% |
| Immigrants | Kuwait | 0.0 /100 | #299 | Tragic 62.4% |
| Immigrants | Africa | 0.0 /100 | #300 | Tragic 62.4% |
| Immigrants | Albania | 0.0 /100 | #301 | Tragic 62.4% |
| Immigrants | Kenya | 0.0 /100 | #302 | Tragic 62.3% |
| Cree | 0.0 /100 | #303 | Tragic 62.3% |
| Iroquois | 0.0 /100 | #304 | Tragic 62.2% |
| Bermudans | 0.0 /100 | #305 | Tragic 62.2% |
| Africans | 0.0 /100 | #306 | Tragic 62.1% |
| Immigrants | Norway | 0.0 /100 | #307 | Tragic 62.1% |
| Chippewa | 0.0 /100 | #308 | Tragic 62.1% |
| Sub-Saharan Africans | 0.0 /100 | #309 | Tragic 62.1% |
| Immigrants | Liberia | 0.0 /100 | #310 | Tragic 62.0% |
| Immigrants | Morocco | 0.0 /100 | #311 | Tragic 62.0% |
| Immigrants | Latvia | 0.0 /100 | #312 | Tragic 62.0% |
| Liberians | 0.0 /100 | #313 | Tragic 62.0% |
| Immigrants | Cabo Verde | 0.0 /100 | #314 | Tragic 61.9% |
| Moroccans | 0.0 /100 | #315 | Tragic 61.9% |
| Immigrants | Middle Africa | 0.0 /100 | #316 | Tragic 61.9% |