French American Indian vs Yuman Family Households
COMPARE
French American Indian
Yuman
Family Households
Family Households Comparison
French American Indians
Yuman
62.4%
FAMILY HOUSEHOLDS
0.0/ 100
METRIC RATING
297th/ 347
METRIC RANK
69.3%
FAMILY HOUSEHOLDS
100.0/ 100
METRIC RATING
5th/ 347
METRIC RANK
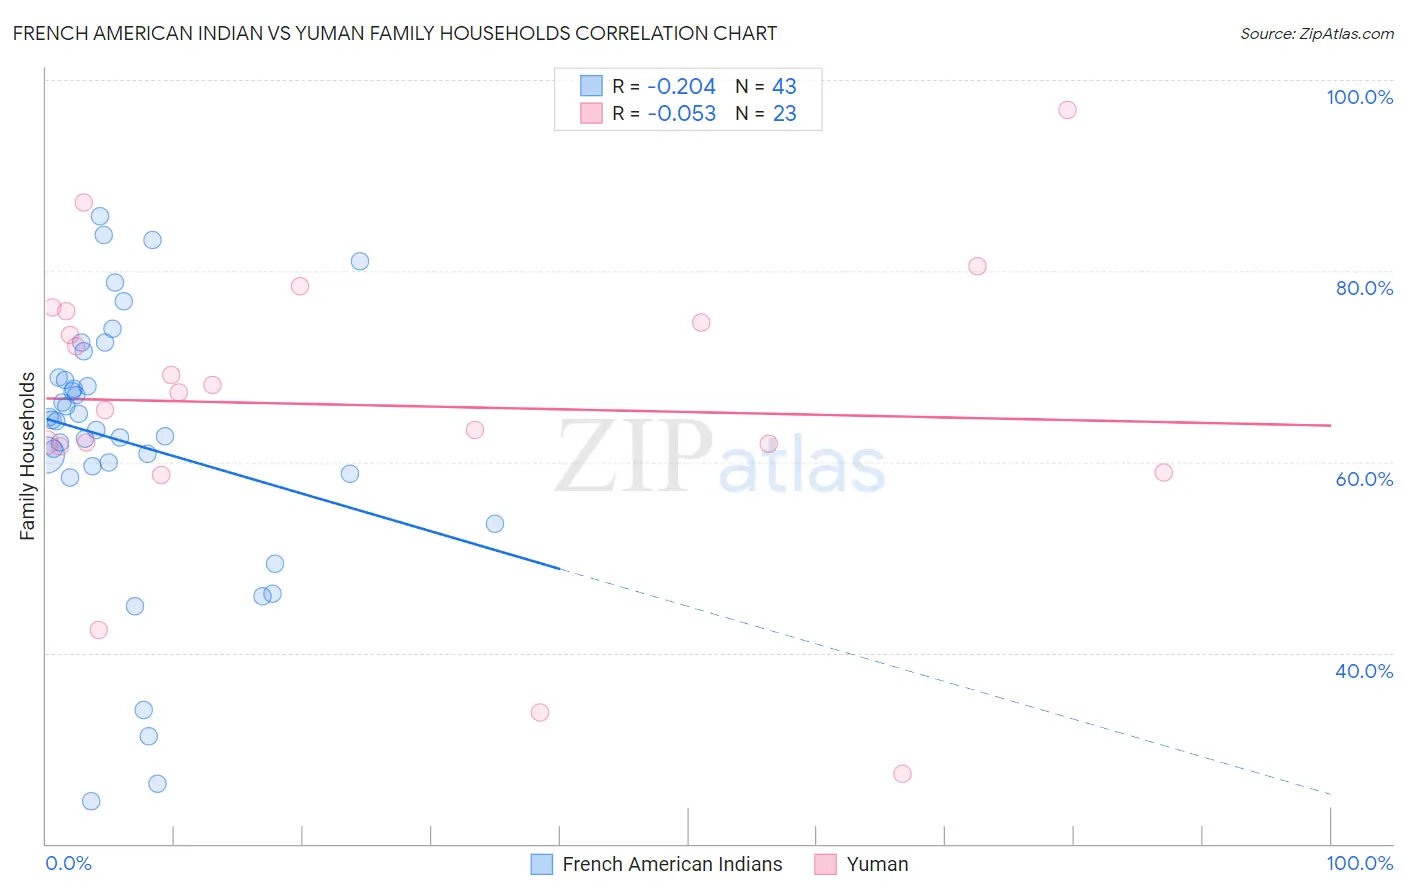
French American Indian vs Yuman Family Households Correlation Chart
The statistical analysis conducted on geographies consisting of 131,961,185 people shows a weak negative correlation between the proportion of French American Indians and percentage of family households in the United States with a correlation coefficient (R) of -0.204 and weighted average of 62.4%. Similarly, the statistical analysis conducted on geographies consisting of 40,663,643 people shows a slight negative correlation between the proportion of Yuman and percentage of family households in the United States with a correlation coefficient (R) of -0.053 and weighted average of 69.3%, a difference of 11.0%.
Family Households Correlation Summary
| Measurement | French American Indian | Yuman |
| Minimum | 24.4% | 27.3% |
| Maximum | 85.7% | 96.9% |
| Range | 61.3% | 69.6% |
| Mean | 62.0% | 65.9% |
| Median | 64.2% | 67.2% |
| Interquartile 25% (IQ1) | 58.8% | 61.6% |
| Interquartile 75% (IQ3) | 68.8% | 75.7% |
| Interquartile Range (IQR) | 10.1% | 14.1% |
| Standard Deviation (Sample) | 14.3% | 15.7% |
| Standard Deviation (Population) | 14.1% | 15.4% |
Similar Demographics by Family Households
Demographics Similar to French American Indians by Family Households
In terms of family households, the demographic groups most similar to French American Indians are Slovene (62.4%, a difference of 0.010%), Okinawan (62.5%, a difference of 0.020%), Immigrants from Spain (62.4%, a difference of 0.030%), Barbadian (62.5%, a difference of 0.040%), and Immigrants from Kuwait (62.4%, a difference of 0.090%).
| Demographics | Rating | Rank | Family Households |
| Immigrants | Grenada | 0.0 /100 | #290 | Tragic 62.6% |
| U.S. Virgin Islanders | 0.0 /100 | #291 | Tragic 62.6% |
| Immigrants | Burma/Myanmar | 0.0 /100 | #292 | Tragic 62.6% |
| Immigrants | Sweden | 0.0 /100 | #293 | Tragic 62.5% |
| Barbadians | 0.0 /100 | #294 | Tragic 62.5% |
| Okinawans | 0.0 /100 | #295 | Tragic 62.5% |
| Slovenes | 0.0 /100 | #296 | Tragic 62.4% |
| French American Indians | 0.0 /100 | #297 | Tragic 62.4% |
| Immigrants | Spain | 0.0 /100 | #298 | Tragic 62.4% |
| Immigrants | Kuwait | 0.0 /100 | #299 | Tragic 62.4% |
| Immigrants | Africa | 0.0 /100 | #300 | Tragic 62.4% |
| Immigrants | Albania | 0.0 /100 | #301 | Tragic 62.4% |
| Immigrants | Kenya | 0.0 /100 | #302 | Tragic 62.3% |
| Cree | 0.0 /100 | #303 | Tragic 62.3% |
| Iroquois | 0.0 /100 | #304 | Tragic 62.2% |
Demographics Similar to Yuman by Family Households
In terms of family households, the demographic groups most similar to Yuman are Yakama (69.3%, a difference of 0.030%), Immigrants from Mexico (69.1%, a difference of 0.24%), Mexican (69.0%, a difference of 0.45%), Tongan (69.6%, a difference of 0.47%), and Immigrants from Fiji (68.8%, a difference of 0.77%).
| Demographics | Rating | Rank | Family Households |
| Yup'ik | 100 /100 | #1 | Exceptional 72.4% |
| Spanish American Indians | 100.0 /100 | #2 | Exceptional 71.2% |
| Tongans | 100.0 /100 | #3 | Exceptional 69.6% |
| Yakama | 100.0 /100 | #4 | Exceptional 69.3% |
| Yuman | 100.0 /100 | #5 | Exceptional 69.3% |
| Immigrants | Mexico | 100.0 /100 | #6 | Exceptional 69.1% |
| Mexicans | 100.0 /100 | #7 | Exceptional 69.0% |
| Immigrants | Fiji | 100.0 /100 | #8 | Exceptional 68.8% |
| Native Hawaiians | 100.0 /100 | #9 | Exceptional 68.4% |
| Immigrants | Philippines | 100.0 /100 | #10 | Exceptional 68.3% |
| Immigrants | Central America | 100.0 /100 | #11 | Exceptional 68.3% |
| Koreans | 100.0 /100 | #12 | Exceptional 68.3% |
| Pueblo | 100.0 /100 | #13 | Exceptional 68.2% |
| Immigrants | Cuba | 100.0 /100 | #14 | Exceptional 68.2% |
| Assyrians/Chaldeans/Syriacs | 100.0 /100 | #15 | Exceptional 68.2% |