French American Indian vs Immigrants from Ghana Family Households
COMPARE
French American Indian
Immigrants from Ghana
Family Households
Family Households Comparison
French American Indians
Immigrants from Ghana
62.4%
FAMILY HOUSEHOLDS
0.0/ 100
METRIC RATING
297th/ 347
METRIC RANK
63.4%
FAMILY HOUSEHOLDS
1.6/ 100
METRIC RATING
246th/ 347
METRIC RANK
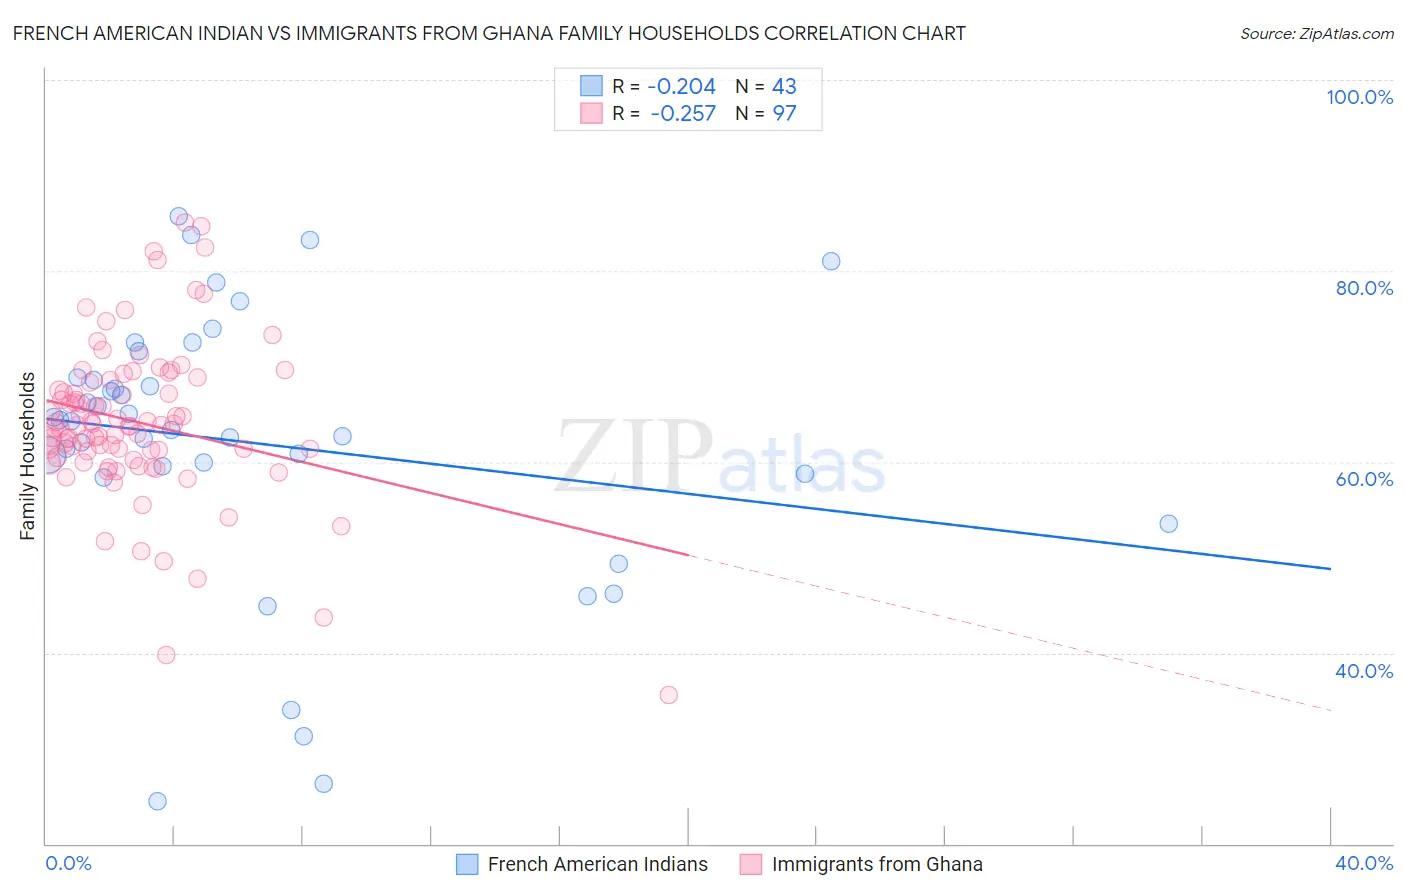
French American Indian vs Immigrants from Ghana Family Households Correlation Chart
The statistical analysis conducted on geographies consisting of 131,961,185 people shows a weak negative correlation between the proportion of French American Indians and percentage of family households in the United States with a correlation coefficient (R) of -0.204 and weighted average of 62.4%. Similarly, the statistical analysis conducted on geographies consisting of 199,806,163 people shows a weak negative correlation between the proportion of Immigrants from Ghana and percentage of family households in the United States with a correlation coefficient (R) of -0.257 and weighted average of 63.4%, a difference of 1.5%.
Family Households Correlation Summary
| Measurement | French American Indian | Immigrants from Ghana |
| Minimum | 24.4% | 35.6% |
| Maximum | 85.7% | 85.0% |
| Range | 61.3% | 49.4% |
| Mean | 62.0% | 64.2% |
| Median | 64.2% | 63.8% |
| Interquartile 25% (IQ1) | 58.8% | 60.8% |
| Interquartile 75% (IQ3) | 68.8% | 68.4% |
| Interquartile Range (IQR) | 10.1% | 7.6% |
| Standard Deviation (Sample) | 14.3% | 8.3% |
| Standard Deviation (Population) | 14.1% | 8.2% |
Similar Demographics by Family Households
Demographics Similar to French American Indians by Family Households
In terms of family households, the demographic groups most similar to French American Indians are Slovene (62.4%, a difference of 0.010%), Okinawan (62.5%, a difference of 0.020%), Immigrants from Spain (62.4%, a difference of 0.030%), Barbadian (62.5%, a difference of 0.040%), and Immigrants from Kuwait (62.4%, a difference of 0.090%).
| Demographics | Rating | Rank | Family Households |
| Immigrants | Grenada | 0.0 /100 | #290 | Tragic 62.6% |
| U.S. Virgin Islanders | 0.0 /100 | #291 | Tragic 62.6% |
| Immigrants | Burma/Myanmar | 0.0 /100 | #292 | Tragic 62.6% |
| Immigrants | Sweden | 0.0 /100 | #293 | Tragic 62.5% |
| Barbadians | 0.0 /100 | #294 | Tragic 62.5% |
| Okinawans | 0.0 /100 | #295 | Tragic 62.5% |
| Slovenes | 0.0 /100 | #296 | Tragic 62.4% |
| French American Indians | 0.0 /100 | #297 | Tragic 62.4% |
| Immigrants | Spain | 0.0 /100 | #298 | Tragic 62.4% |
| Immigrants | Kuwait | 0.0 /100 | #299 | Tragic 62.4% |
| Immigrants | Africa | 0.0 /100 | #300 | Tragic 62.4% |
| Immigrants | Albania | 0.0 /100 | #301 | Tragic 62.4% |
| Immigrants | Kenya | 0.0 /100 | #302 | Tragic 62.3% |
| Cree | 0.0 /100 | #303 | Tragic 62.3% |
| Iroquois | 0.0 /100 | #304 | Tragic 62.2% |
Demographics Similar to Immigrants from Ghana by Family Households
In terms of family households, the demographic groups most similar to Immigrants from Ghana are Immigrants from Uzbekistan (63.4%, a difference of 0.010%), Eastern European (63.4%, a difference of 0.020%), Immigrants from Dominica (63.4%, a difference of 0.020%), Dominican (63.4%, a difference of 0.020%), and Russian (63.4%, a difference of 0.030%).
| Demographics | Rating | Rank | Family Households |
| Aleuts | 1.9 /100 | #239 | Tragic 63.4% |
| South Africans | 1.9 /100 | #240 | Tragic 63.4% |
| Immigrants | St. Vincent and the Grenadines | 1.9 /100 | #241 | Tragic 63.4% |
| Immigrants | Israel | 1.8 /100 | #242 | Tragic 63.4% |
| Immigrants | Czechoslovakia | 1.8 /100 | #243 | Tragic 63.4% |
| Eastern Europeans | 1.6 /100 | #244 | Tragic 63.4% |
| Immigrants | Dominica | 1.6 /100 | #245 | Tragic 63.4% |
| Immigrants | Ghana | 1.6 /100 | #246 | Tragic 63.4% |
| Immigrants | Uzbekistan | 1.5 /100 | #247 | Tragic 63.4% |
| Dominicans | 1.5 /100 | #248 | Tragic 63.4% |
| Russians | 1.4 /100 | #249 | Tragic 63.4% |
| Immigrants | Japan | 1.4 /100 | #250 | Tragic 63.4% |
| Taiwanese | 1.2 /100 | #251 | Tragic 63.3% |
| Bahamians | 1.1 /100 | #252 | Tragic 63.3% |
| Immigrants | Dominican Republic | 1.0 /100 | #253 | Tragic 63.3% |