Finnish vs Immigrants from Caribbean Unemployment Among Women with Children Ages 6 to 17 years
COMPARE
Finnish
Immigrants from Caribbean
Unemployment Among Women with Children Ages 6 to 17 years
Unemployment Among Women with Children Ages 6 to 17 years Comparison
Finns
Immigrants from Caribbean
9.2%
UNEMPLOYMENT AMONG WOMEN WITH CHILDREN AGES 6 TO 17 YEARS
10.0/ 100
METRIC RATING
210th/ 347
METRIC RANK
10.1%
UNEMPLOYMENT AMONG WOMEN WITH CHILDREN AGES 6 TO 17 YEARS
0.0/ 100
METRIC RATING
297th/ 347
METRIC RANK
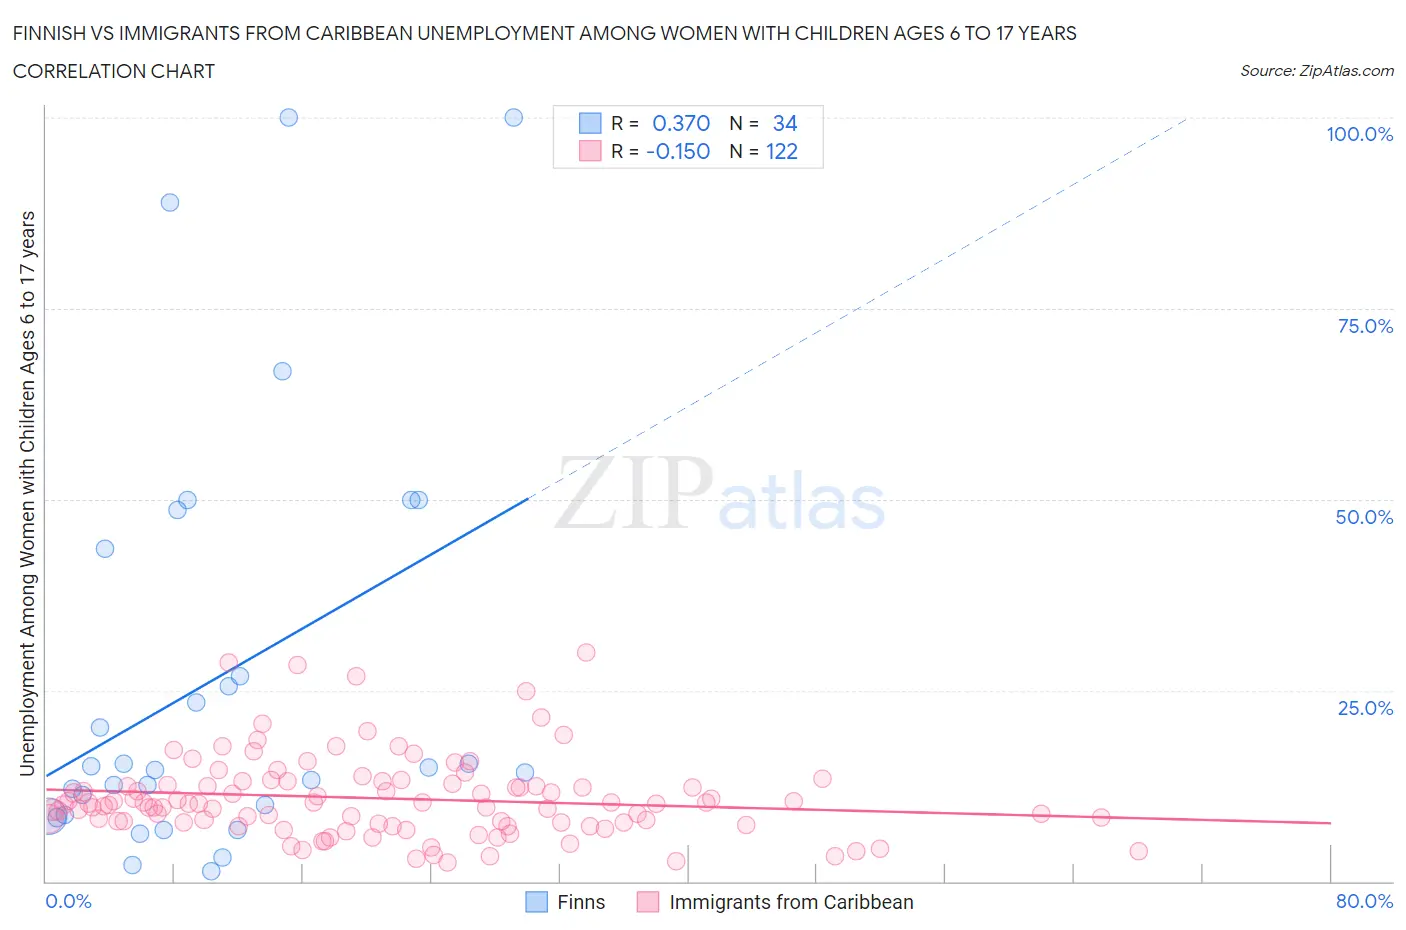
Finnish vs Immigrants from Caribbean Unemployment Among Women with Children Ages 6 to 17 years Correlation Chart
The statistical analysis conducted on geographies consisting of 277,451,978 people shows a mild positive correlation between the proportion of Finns and unemployment rate among women with children between the ages 6 and 17 in the United States with a correlation coefficient (R) of 0.370 and weighted average of 9.2%. Similarly, the statistical analysis conducted on geographies consisting of 317,614,435 people shows a poor negative correlation between the proportion of Immigrants from Caribbean and unemployment rate among women with children between the ages 6 and 17 in the United States with a correlation coefficient (R) of -0.150 and weighted average of 10.1%, a difference of 9.6%.
Unemployment Among Women with Children Ages 6 to 17 years Correlation Summary
| Measurement | Finnish | Immigrants from Caribbean |
| Minimum | 1.3% | 2.4% |
| Maximum | 100.0% | 30.0% |
| Range | 98.7% | 27.6% |
| Mean | 26.7% | 10.9% |
| Median | 14.7% | 10.1% |
| Interquartile 25% (IQ1) | 8.6% | 7.7% |
| Interquartile 75% (IQ3) | 43.5% | 12.8% |
| Interquartile Range (IQR) | 34.9% | 5.1% |
| Standard Deviation (Sample) | 27.4% | 5.3% |
| Standard Deviation (Population) | 27.0% | 5.3% |
Similar Demographics by Unemployment Among Women with Children Ages 6 to 17 years
Demographics Similar to Finns by Unemployment Among Women with Children Ages 6 to 17 years
In terms of unemployment among women with children ages 6 to 17 years, the demographic groups most similar to Finns are Immigrants from Cuba (9.2%, a difference of 0.050%), Salvadoran (9.2%, a difference of 0.090%), Cuban (9.2%, a difference of 0.10%), Immigrants from Peru (9.2%, a difference of 0.10%), and Peruvian (9.2%, a difference of 0.13%).
| Demographics | Rating | Rank | Unemployment Among Women with Children Ages 6 to 17 years |
| Maltese | 15.3 /100 | #203 | Poor 9.1% |
| Immigrants | Canada | 15.3 /100 | #204 | Poor 9.1% |
| Immigrants | Western Europe | 14.1 /100 | #205 | Poor 9.1% |
| Immigrants | North America | 12.7 /100 | #206 | Poor 9.2% |
| Cubans | 10.9 /100 | #207 | Poor 9.2% |
| Immigrants | Peru | 10.8 /100 | #208 | Poor 9.2% |
| Salvadorans | 10.7 /100 | #209 | Poor 9.2% |
| Finns | 10.0 /100 | #210 | Tragic 9.2% |
| Immigrants | Cuba | 9.6 /100 | #211 | Tragic 9.2% |
| Peruvians | 9.0 /100 | #212 | Tragic 9.2% |
| Spaniards | 8.2 /100 | #213 | Tragic 9.2% |
| Iroquois | 7.5 /100 | #214 | Tragic 9.2% |
| Immigrants | Germany | 7.2 /100 | #215 | Tragic 9.2% |
| Immigrants | Uruguay | 7.2 /100 | #216 | Tragic 9.2% |
| Germans | 7.2 /100 | #217 | Tragic 9.2% |
Demographics Similar to Immigrants from Caribbean by Unemployment Among Women with Children Ages 6 to 17 years
In terms of unemployment among women with children ages 6 to 17 years, the demographic groups most similar to Immigrants from Caribbean are Immigrants from Western Africa (10.1%, a difference of 0.020%), Immigrants from Haiti (10.1%, a difference of 0.30%), Immigrants from Honduras (10.1%, a difference of 0.32%), Nigerian (10.1%, a difference of 0.34%), and Cherokee (10.0%, a difference of 0.36%).
| Demographics | Rating | Rank | Unemployment Among Women with Children Ages 6 to 17 years |
| Sub-Saharan Africans | 0.0 /100 | #290 | Tragic 10.0% |
| Immigrants | Nonimmigrants | 0.0 /100 | #291 | Tragic 10.0% |
| Carpatho Rusyns | 0.0 /100 | #292 | Tragic 10.0% |
| Haitians | 0.0 /100 | #293 | Tragic 10.0% |
| Ecuadorians | 0.0 /100 | #294 | Tragic 10.0% |
| Cherokee | 0.0 /100 | #295 | Tragic 10.0% |
| Immigrants | Western Africa | 0.0 /100 | #296 | Tragic 10.1% |
| Immigrants | Caribbean | 0.0 /100 | #297 | Tragic 10.1% |
| Immigrants | Haiti | 0.0 /100 | #298 | Tragic 10.1% |
| Immigrants | Honduras | 0.0 /100 | #299 | Tragic 10.1% |
| Nigerians | 0.0 /100 | #300 | Tragic 10.1% |
| Immigrants | Bahamas | 0.0 /100 | #301 | Tragic 10.1% |
| Venezuelans | 0.0 /100 | #302 | Tragic 10.2% |
| Immigrants | Ecuador | 0.0 /100 | #303 | Tragic 10.2% |
| Immigrants | Venezuela | 0.0 /100 | #304 | Tragic 10.2% |