Finnish vs Immigrants from Morocco Divorced or Separated
COMPARE
Finnish
Immigrants from Morocco
Divorced or Separated
Divorced or Separated Comparison
Finns
Immigrants from Morocco
12.5%
DIVORCED OR SEPARATED
1.8/ 100
METRIC RATING
249th/ 347
METRIC RANK
11.9%
DIVORCED OR SEPARATED
82.9/ 100
METRIC RATING
141st/ 347
METRIC RANK
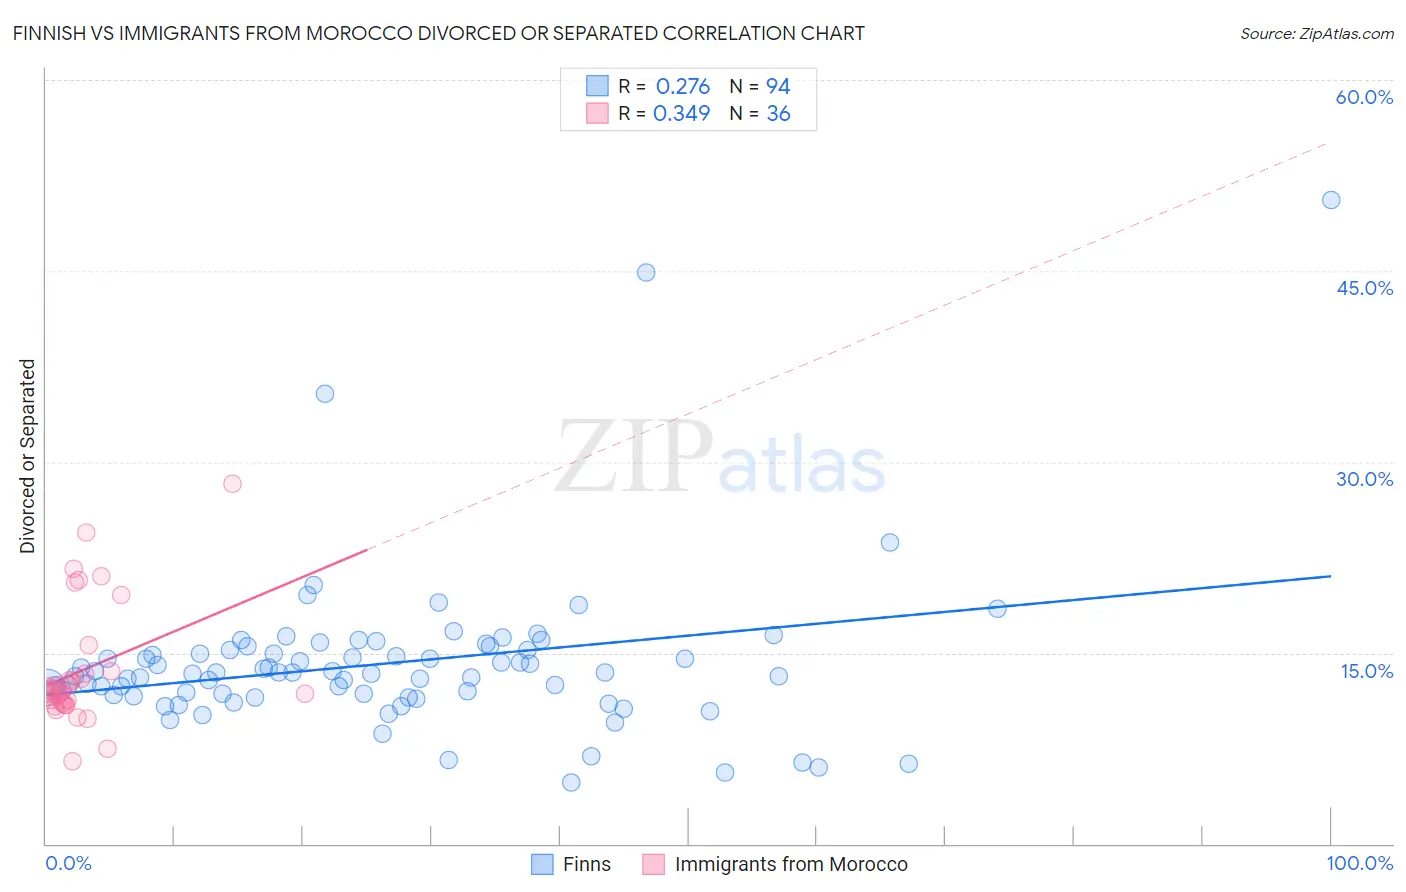
Finnish vs Immigrants from Morocco Divorced or Separated Correlation Chart
The statistical analysis conducted on geographies consisting of 404,587,172 people shows a weak positive correlation between the proportion of Finns and percentage of population currently divorced or separated in the United States with a correlation coefficient (R) of 0.276 and weighted average of 12.5%. Similarly, the statistical analysis conducted on geographies consisting of 178,911,548 people shows a mild positive correlation between the proportion of Immigrants from Morocco and percentage of population currently divorced or separated in the United States with a correlation coefficient (R) of 0.349 and weighted average of 11.9%, a difference of 4.9%.
Divorced or Separated Correlation Summary
| Measurement | Finnish | Immigrants from Morocco |
| Minimum | 4.8% | 6.5% |
| Maximum | 50.5% | 28.3% |
| Range | 45.7% | 21.8% |
| Mean | 14.1% | 13.6% |
| Median | 13.4% | 12.1% |
| Interquartile 25% (IQ1) | 11.7% | 11.0% |
| Interquartile 75% (IQ3) | 15.2% | 13.5% |
| Interquartile Range (IQR) | 3.5% | 2.5% |
| Standard Deviation (Sample) | 6.3% | 4.8% |
| Standard Deviation (Population) | 6.3% | 4.7% |
Similar Demographics by Divorced or Separated
Demographics Similar to Finns by Divorced or Separated
In terms of divorced or separated, the demographic groups most similar to Finns are Nepalese (12.5%, a difference of 0.010%), German (12.5%, a difference of 0.040%), Immigrants from West Indies (12.5%, a difference of 0.070%), Hispanic or Latino (12.5%, a difference of 0.090%), and Irish (12.5%, a difference of 0.27%).
| Demographics | Rating | Rank | Divorced or Separated |
| Dutch | 3.1 /100 | #242 | Tragic 12.4% |
| Immigrants | Latin America | 2.8 /100 | #243 | Tragic 12.4% |
| Alaska Natives | 2.5 /100 | #244 | Tragic 12.4% |
| Hispanics or Latinos | 2.0 /100 | #245 | Tragic 12.5% |
| Immigrants | West Indies | 1.9 /100 | #246 | Tragic 12.5% |
| Germans | 1.8 /100 | #247 | Tragic 12.5% |
| Nepalese | 1.8 /100 | #248 | Tragic 12.5% |
| Finns | 1.8 /100 | #249 | Tragic 12.5% |
| Irish | 1.3 /100 | #250 | Tragic 12.5% |
| Aleuts | 1.3 /100 | #251 | Tragic 12.5% |
| Liberians | 0.9 /100 | #252 | Tragic 12.6% |
| Somalis | 0.9 /100 | #253 | Tragic 12.6% |
| Senegalese | 0.8 /100 | #254 | Tragic 12.6% |
| Welsh | 0.7 /100 | #255 | Tragic 12.6% |
| Immigrants | Colombia | 0.6 /100 | #256 | Tragic 12.6% |
Demographics Similar to Immigrants from Morocco by Divorced or Separated
In terms of divorced or separated, the demographic groups most similar to Immigrants from Morocco are Lebanese (11.9%, a difference of 0.030%), Australian (11.9%, a difference of 0.050%), Immigrants from Netherlands (11.9%, a difference of 0.060%), Alsatian (11.9%, a difference of 0.070%), and Immigrants from Zimbabwe (11.9%, a difference of 0.090%).
| Demographics | Rating | Rank | Divorced or Separated |
| Argentineans | 85.1 /100 | #134 | Excellent 11.9% |
| Danes | 84.8 /100 | #135 | Excellent 11.9% |
| Carpatho Rusyns | 84.8 /100 | #136 | Excellent 11.9% |
| Alsatians | 84.0 /100 | #137 | Excellent 11.9% |
| Immigrants | Netherlands | 83.9 /100 | #138 | Excellent 11.9% |
| Australians | 83.6 /100 | #139 | Excellent 11.9% |
| Lebanese | 83.4 /100 | #140 | Excellent 11.9% |
| Immigrants | Morocco | 82.9 /100 | #141 | Excellent 11.9% |
| Immigrants | Zimbabwe | 81.5 /100 | #142 | Excellent 11.9% |
| Pakistanis | 81.3 /100 | #143 | Excellent 11.9% |
| Peruvians | 80.9 /100 | #144 | Excellent 11.9% |
| Croatians | 80.6 /100 | #145 | Excellent 11.9% |
| Immigrants | Grenada | 79.1 /100 | #146 | Good 11.9% |
| Poles | 78.6 /100 | #147 | Good 11.9% |
| Italians | 77.8 /100 | #148 | Good 11.9% |