Finnish vs Immigrants from Western Europe Divorced or Separated
COMPARE
Finnish
Immigrants from Western Europe
Divorced or Separated
Divorced or Separated Comparison
Finns
Immigrants from Western Europe
12.5%
DIVORCED OR SEPARATED
1.8/ 100
METRIC RATING
249th/ 347
METRIC RANK
12.1%
DIVORCED OR SEPARATED
45.6/ 100
METRIC RATING
179th/ 347
METRIC RANK
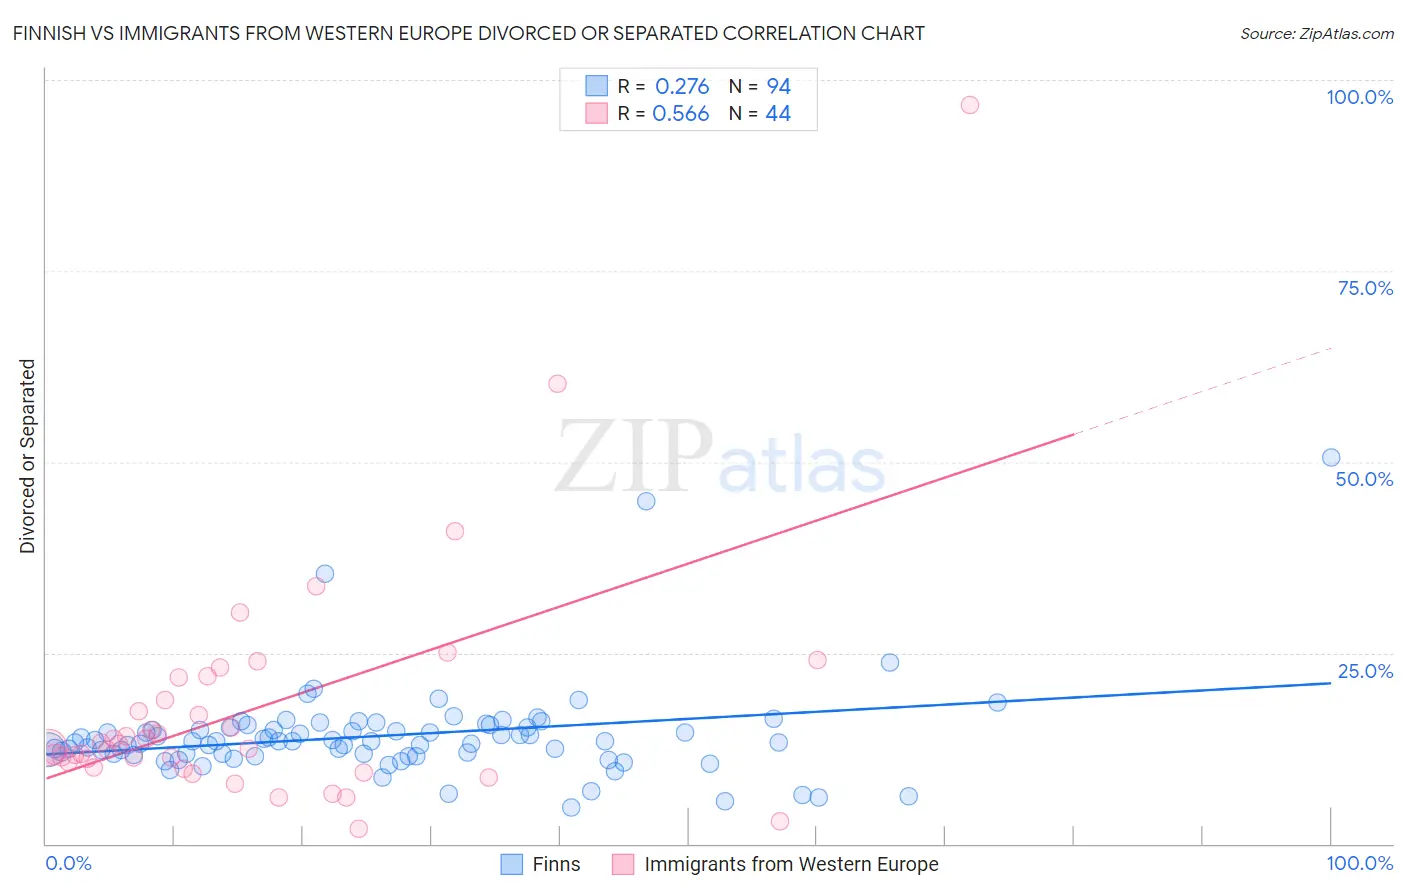
Finnish vs Immigrants from Western Europe Divorced or Separated Correlation Chart
The statistical analysis conducted on geographies consisting of 404,587,172 people shows a weak positive correlation between the proportion of Finns and percentage of population currently divorced or separated in the United States with a correlation coefficient (R) of 0.276 and weighted average of 12.5%. Similarly, the statistical analysis conducted on geographies consisting of 493,891,815 people shows a substantial positive correlation between the proportion of Immigrants from Western Europe and percentage of population currently divorced or separated in the United States with a correlation coefficient (R) of 0.566 and weighted average of 12.1%, a difference of 3.3%.
Divorced or Separated Correlation Summary
| Measurement | Finnish | Immigrants from Western Europe |
| Minimum | 4.8% | 1.9% |
| Maximum | 50.5% | 96.8% |
| Range | 45.7% | 94.9% |
| Mean | 14.1% | 17.6% |
| Median | 13.4% | 12.9% |
| Interquartile 25% (IQ1) | 11.7% | 10.3% |
| Interquartile 75% (IQ3) | 15.2% | 20.3% |
| Interquartile Range (IQR) | 3.5% | 9.9% |
| Standard Deviation (Sample) | 6.3% | 16.0% |
| Standard Deviation (Population) | 6.3% | 15.8% |
Similar Demographics by Divorced or Separated
Demographics Similar to Finns by Divorced or Separated
In terms of divorced or separated, the demographic groups most similar to Finns are Nepalese (12.5%, a difference of 0.010%), German (12.5%, a difference of 0.040%), Immigrants from West Indies (12.5%, a difference of 0.070%), Hispanic or Latino (12.5%, a difference of 0.090%), and Irish (12.5%, a difference of 0.27%).
| Demographics | Rating | Rank | Divorced or Separated |
| Dutch | 3.1 /100 | #242 | Tragic 12.4% |
| Immigrants | Latin America | 2.8 /100 | #243 | Tragic 12.4% |
| Alaska Natives | 2.5 /100 | #244 | Tragic 12.4% |
| Hispanics or Latinos | 2.0 /100 | #245 | Tragic 12.5% |
| Immigrants | West Indies | 1.9 /100 | #246 | Tragic 12.5% |
| Germans | 1.8 /100 | #247 | Tragic 12.5% |
| Nepalese | 1.8 /100 | #248 | Tragic 12.5% |
| Finns | 1.8 /100 | #249 | Tragic 12.5% |
| Irish | 1.3 /100 | #250 | Tragic 12.5% |
| Aleuts | 1.3 /100 | #251 | Tragic 12.5% |
| Liberians | 0.9 /100 | #252 | Tragic 12.6% |
| Somalis | 0.9 /100 | #253 | Tragic 12.6% |
| Senegalese | 0.8 /100 | #254 | Tragic 12.6% |
| Welsh | 0.7 /100 | #255 | Tragic 12.6% |
| Immigrants | Colombia | 0.6 /100 | #256 | Tragic 12.6% |
Demographics Similar to Immigrants from Western Europe by Divorced or Separated
In terms of divorced or separated, the demographic groups most similar to Immigrants from Western Europe are Ghanaian (12.1%, a difference of 0.010%), Barbadian (12.1%, a difference of 0.020%), Immigrants from Canada (12.1%, a difference of 0.050%), Brazilian (12.1%, a difference of 0.080%), and Immigrants from Ethiopia (12.1%, a difference of 0.090%).
| Demographics | Rating | Rank | Divorced or Separated |
| Immigrants | Mexico | 53.2 /100 | #172 | Average 12.0% |
| Immigrants | Moldova | 50.4 /100 | #173 | Average 12.1% |
| Hawaiians | 50.0 /100 | #174 | Average 12.1% |
| Immigrants | Sierra Leone | 50.0 /100 | #175 | Average 12.1% |
| Pennsylvania Germans | 48.9 /100 | #176 | Average 12.1% |
| Brazilians | 47.7 /100 | #177 | Average 12.1% |
| Ghanaians | 45.9 /100 | #178 | Average 12.1% |
| Immigrants | Western Europe | 45.6 /100 | #179 | Average 12.1% |
| Barbadians | 45.0 /100 | #180 | Average 12.1% |
| Immigrants | Canada | 44.0 /100 | #181 | Average 12.1% |
| Immigrants | Ethiopia | 43.1 /100 | #182 | Average 12.1% |
| Immigrants | Central America | 42.9 /100 | #183 | Average 12.1% |
| Immigrants | North America | 41.1 /100 | #184 | Average 12.1% |
| Immigrants | Nigeria | 40.5 /100 | #185 | Average 12.1% |
| Immigrants | Chile | 39.0 /100 | #186 | Fair 12.1% |