Finnish vs Immigrants from Belize Currently Married
COMPARE
Finnish
Immigrants from Belize
Currently Married
Currently Married Comparison
Finns
Immigrants from Belize
48.8%
CURRENTLY MARRIED
99.3/ 100
METRIC RATING
42nd/ 347
METRIC RANK
41.8%
CURRENTLY MARRIED
0.0/ 100
METRIC RATING
308th/ 347
METRIC RANK
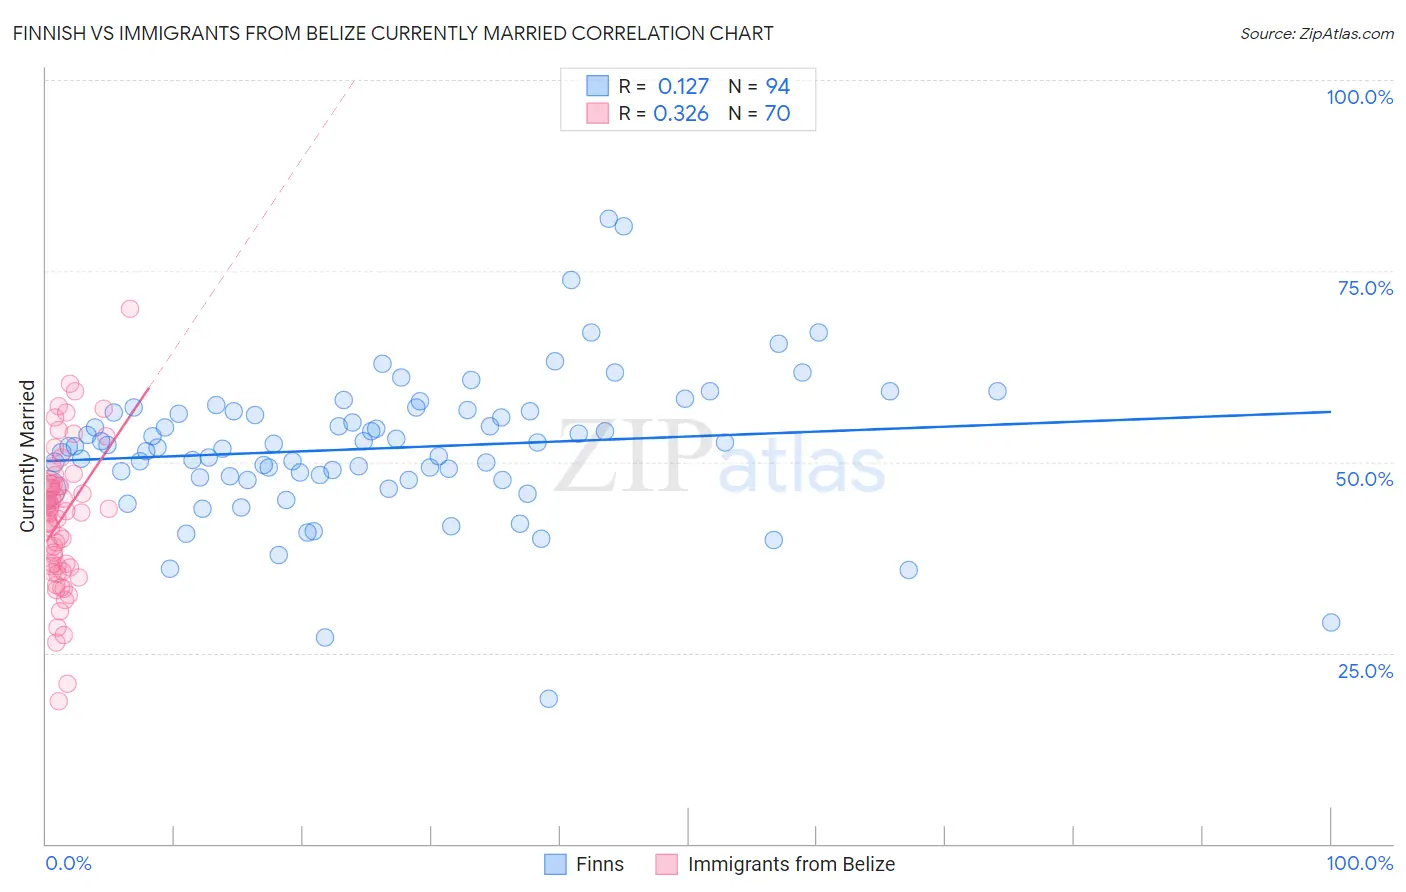
Finnish vs Immigrants from Belize Currently Married Correlation Chart
The statistical analysis conducted on geographies consisting of 404,666,333 people shows a poor positive correlation between the proportion of Finns and percentage of population currently married in the United States with a correlation coefficient (R) of 0.127 and weighted average of 48.8%. Similarly, the statistical analysis conducted on geographies consisting of 130,322,630 people shows a mild positive correlation between the proportion of Immigrants from Belize and percentage of population currently married in the United States with a correlation coefficient (R) of 0.326 and weighted average of 41.8%, a difference of 16.6%.
Currently Married Correlation Summary
| Measurement | Finnish | Immigrants from Belize |
| Minimum | 19.0% | 18.6% |
| Maximum | 81.8% | 70.1% |
| Range | 62.8% | 51.5% |
| Mean | 51.8% | 42.6% |
| Median | 52.0% | 43.4% |
| Interquartile 25% (IQ1) | 47.9% | 36.4% |
| Interquartile 75% (IQ3) | 56.6% | 47.1% |
| Interquartile Range (IQR) | 8.7% | 10.7% |
| Standard Deviation (Sample) | 9.5% | 9.2% |
| Standard Deviation (Population) | 9.4% | 9.2% |
Similar Demographics by Currently Married
Demographics Similar to Finns by Currently Married
In terms of currently married, the demographic groups most similar to Finns are Scotch-Irish (48.7%, a difference of 0.010%), Immigrants from North America (48.7%, a difference of 0.040%), Greek (48.8%, a difference of 0.050%), Immigrants from Canada (48.8%, a difference of 0.060%), and Belgian (48.7%, a difference of 0.060%).
| Demographics | Rating | Rank | Currently Married |
| Immigrants | Northern Europe | 99.4 /100 | #35 | Exceptional 48.8% |
| Italians | 99.4 /100 | #36 | Exceptional 48.8% |
| Hungarians | 99.4 /100 | #37 | Exceptional 48.8% |
| Czechoslovakians | 99.4 /100 | #38 | Exceptional 48.8% |
| British | 99.4 /100 | #39 | Exceptional 48.8% |
| Immigrants | Canada | 99.4 /100 | #40 | Exceptional 48.8% |
| Greeks | 99.3 /100 | #41 | Exceptional 48.8% |
| Finns | 99.3 /100 | #42 | Exceptional 48.8% |
| Scotch-Irish | 99.3 /100 | #43 | Exceptional 48.7% |
| Immigrants | North America | 99.3 /100 | #44 | Exceptional 48.7% |
| Belgians | 99.3 /100 | #45 | Exceptional 48.7% |
| Immigrants | Iran | 99.2 /100 | #46 | Exceptional 48.7% |
| Northern Europeans | 99.2 /100 | #47 | Exceptional 48.7% |
| Austrians | 99.2 /100 | #48 | Exceptional 48.7% |
| Bhutanese | 99.1 /100 | #49 | Exceptional 48.6% |
Demographics Similar to Immigrants from Belize by Currently Married
In terms of currently married, the demographic groups most similar to Immigrants from Belize are African (41.8%, a difference of 0.040%), Immigrants from Liberia (41.8%, a difference of 0.11%), Immigrants from Guyana (41.9%, a difference of 0.17%), Immigrants from Trinidad and Tobago (41.9%, a difference of 0.18%), and Immigrants from Bahamas (41.9%, a difference of 0.22%).
| Demographics | Rating | Rank | Currently Married |
| Immigrants | Yemen | 0.0 /100 | #301 | Tragic 42.1% |
| Immigrants | Zaire | 0.0 /100 | #302 | Tragic 42.0% |
| Sioux | 0.0 /100 | #303 | Tragic 41.9% |
| Immigrants | Bahamas | 0.0 /100 | #304 | Tragic 41.9% |
| Immigrants | Trinidad and Tobago | 0.0 /100 | #305 | Tragic 41.9% |
| Immigrants | Guyana | 0.0 /100 | #306 | Tragic 41.9% |
| Africans | 0.0 /100 | #307 | Tragic 41.8% |
| Immigrants | Belize | 0.0 /100 | #308 | Tragic 41.8% |
| Immigrants | Liberia | 0.0 /100 | #309 | Tragic 41.8% |
| Guyanese | 0.0 /100 | #310 | Tragic 41.6% |
| Trinidadians and Tobagonians | 0.0 /100 | #311 | Tragic 41.5% |
| Somalis | 0.0 /100 | #312 | Tragic 41.5% |
| Jamaicans | 0.0 /100 | #313 | Tragic 41.4% |
| West Indians | 0.0 /100 | #314 | Tragic 41.3% |
| Inupiat | 0.0 /100 | #315 | Tragic 41.3% |