Finnish vs Immigrants from Trinidad and Tobago Currently Married
COMPARE
Finnish
Immigrants from Trinidad and Tobago
Currently Married
Currently Married Comparison
Finns
Immigrants from Trinidad and Tobago
48.8%
CURRENTLY MARRIED
99.3/ 100
METRIC RATING
42nd/ 347
METRIC RANK
41.9%
CURRENTLY MARRIED
0.0/ 100
METRIC RATING
305th/ 347
METRIC RANK
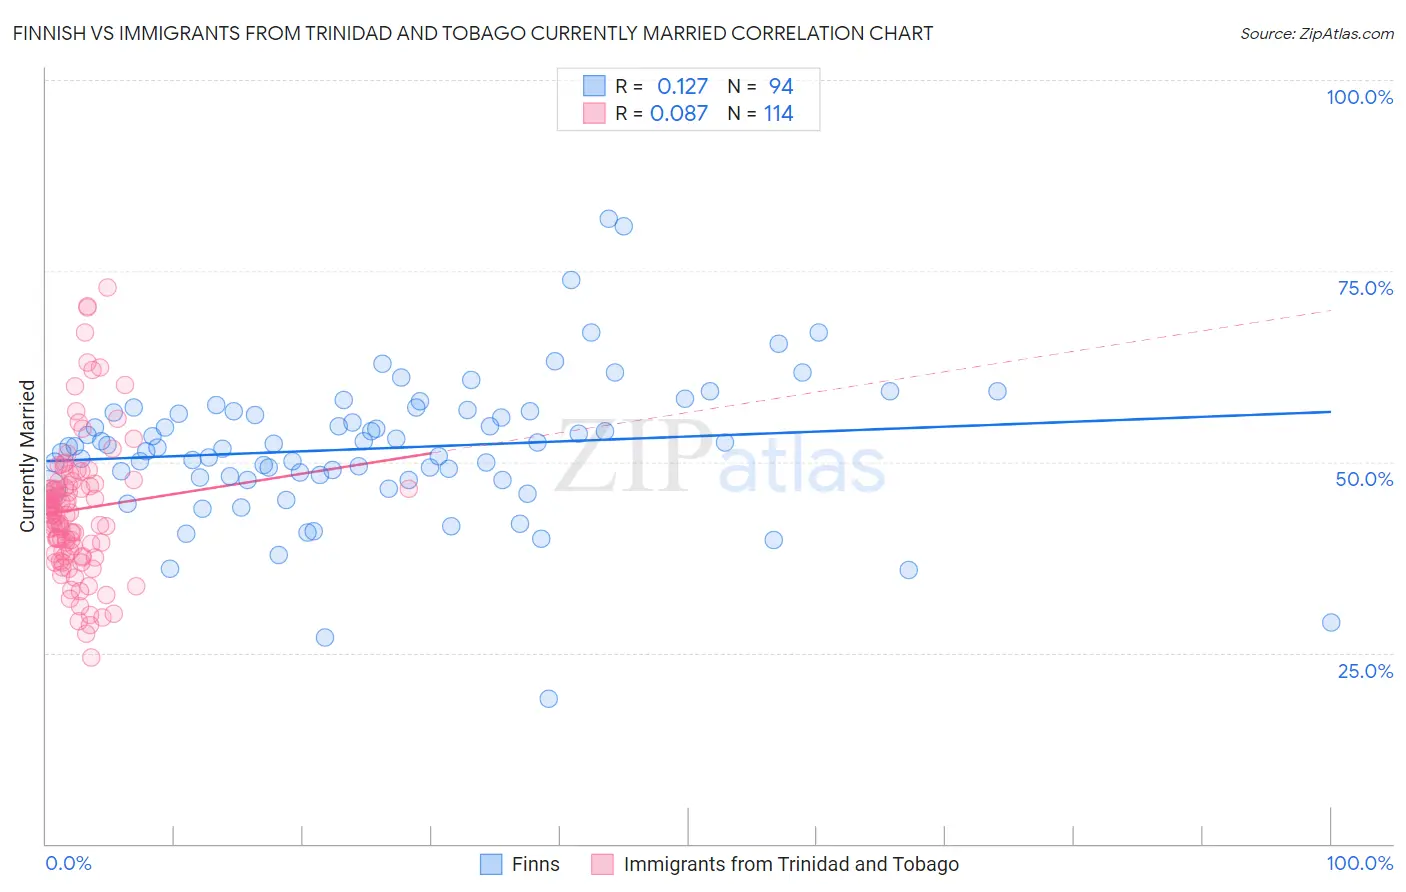
Finnish vs Immigrants from Trinidad and Tobago Currently Married Correlation Chart
The statistical analysis conducted on geographies consisting of 404,666,333 people shows a poor positive correlation between the proportion of Finns and percentage of population currently married in the United States with a correlation coefficient (R) of 0.127 and weighted average of 48.8%. Similarly, the statistical analysis conducted on geographies consisting of 223,527,783 people shows a slight positive correlation between the proportion of Immigrants from Trinidad and Tobago and percentage of population currently married in the United States with a correlation coefficient (R) of 0.087 and weighted average of 41.9%, a difference of 16.4%.
Currently Married Correlation Summary
| Measurement | Finnish | Immigrants from Trinidad and Tobago |
| Minimum | 19.0% | 24.4% |
| Maximum | 81.8% | 72.9% |
| Range | 62.8% | 48.5% |
| Mean | 51.8% | 43.8% |
| Median | 52.0% | 43.4% |
| Interquartile 25% (IQ1) | 47.9% | 38.3% |
| Interquartile 75% (IQ3) | 56.6% | 47.0% |
| Interquartile Range (IQR) | 8.7% | 8.7% |
| Standard Deviation (Sample) | 9.5% | 8.9% |
| Standard Deviation (Population) | 9.4% | 8.9% |
Similar Demographics by Currently Married
Demographics Similar to Finns by Currently Married
In terms of currently married, the demographic groups most similar to Finns are Scotch-Irish (48.7%, a difference of 0.010%), Immigrants from North America (48.7%, a difference of 0.040%), Greek (48.8%, a difference of 0.050%), Immigrants from Canada (48.8%, a difference of 0.060%), and Belgian (48.7%, a difference of 0.060%).
| Demographics | Rating | Rank | Currently Married |
| Immigrants | Northern Europe | 99.4 /100 | #35 | Exceptional 48.8% |
| Italians | 99.4 /100 | #36 | Exceptional 48.8% |
| Hungarians | 99.4 /100 | #37 | Exceptional 48.8% |
| Czechoslovakians | 99.4 /100 | #38 | Exceptional 48.8% |
| British | 99.4 /100 | #39 | Exceptional 48.8% |
| Immigrants | Canada | 99.4 /100 | #40 | Exceptional 48.8% |
| Greeks | 99.3 /100 | #41 | Exceptional 48.8% |
| Finns | 99.3 /100 | #42 | Exceptional 48.8% |
| Scotch-Irish | 99.3 /100 | #43 | Exceptional 48.7% |
| Immigrants | North America | 99.3 /100 | #44 | Exceptional 48.7% |
| Belgians | 99.3 /100 | #45 | Exceptional 48.7% |
| Immigrants | Iran | 99.2 /100 | #46 | Exceptional 48.7% |
| Northern Europeans | 99.2 /100 | #47 | Exceptional 48.7% |
| Austrians | 99.2 /100 | #48 | Exceptional 48.7% |
| Bhutanese | 99.1 /100 | #49 | Exceptional 48.6% |
Demographics Similar to Immigrants from Trinidad and Tobago by Currently Married
In terms of currently married, the demographic groups most similar to Immigrants from Trinidad and Tobago are Immigrants from Guyana (41.9%, a difference of 0.010%), Immigrants from Bahamas (41.9%, a difference of 0.030%), African (41.8%, a difference of 0.14%), Sioux (41.9%, a difference of 0.15%), and Immigrants from Zaire (42.0%, a difference of 0.16%).
| Demographics | Rating | Rank | Currently Married |
| Immigrants | Honduras | 0.0 /100 | #298 | Tragic 42.2% |
| Liberians | 0.0 /100 | #299 | Tragic 42.2% |
| Belizeans | 0.0 /100 | #300 | Tragic 42.2% |
| Immigrants | Yemen | 0.0 /100 | #301 | Tragic 42.1% |
| Immigrants | Zaire | 0.0 /100 | #302 | Tragic 42.0% |
| Sioux | 0.0 /100 | #303 | Tragic 41.9% |
| Immigrants | Bahamas | 0.0 /100 | #304 | Tragic 41.9% |
| Immigrants | Trinidad and Tobago | 0.0 /100 | #305 | Tragic 41.9% |
| Immigrants | Guyana | 0.0 /100 | #306 | Tragic 41.9% |
| Africans | 0.0 /100 | #307 | Tragic 41.8% |
| Immigrants | Belize | 0.0 /100 | #308 | Tragic 41.8% |
| Immigrants | Liberia | 0.0 /100 | #309 | Tragic 41.8% |
| Guyanese | 0.0 /100 | #310 | Tragic 41.6% |
| Trinidadians and Tobagonians | 0.0 /100 | #311 | Tragic 41.5% |
| Somalis | 0.0 /100 | #312 | Tragic 41.5% |