Finnish vs Portuguese Currently Married
COMPARE
Finnish
Portuguese
Currently Married
Currently Married Comparison
Finns
Portuguese
48.8%
CURRENTLY MARRIED
99.3/ 100
METRIC RATING
42nd/ 347
METRIC RANK
47.3%
CURRENTLY MARRIED
84.2/ 100
METRIC RATING
128th/ 347
METRIC RANK
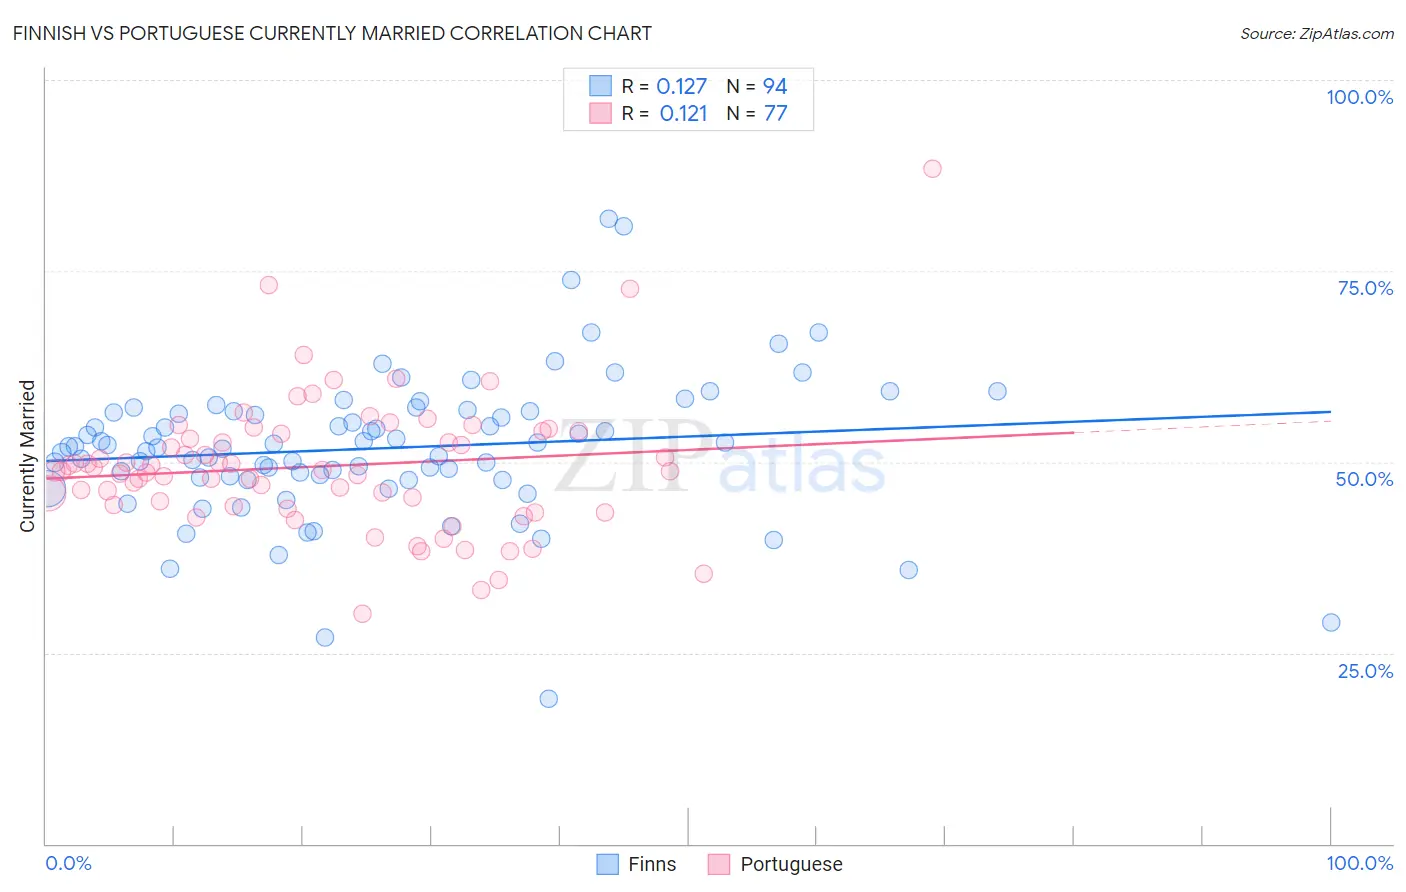
Finnish vs Portuguese Currently Married Correlation Chart
The statistical analysis conducted on geographies consisting of 404,666,333 people shows a poor positive correlation between the proportion of Finns and percentage of population currently married in the United States with a correlation coefficient (R) of 0.127 and weighted average of 48.8%. Similarly, the statistical analysis conducted on geographies consisting of 450,286,612 people shows a poor positive correlation between the proportion of Portuguese and percentage of population currently married in the United States with a correlation coefficient (R) of 0.121 and weighted average of 47.3%, a difference of 3.0%.
Currently Married Correlation Summary
| Measurement | Finnish | Portuguese |
| Minimum | 19.0% | 30.1% |
| Maximum | 81.8% | 88.3% |
| Range | 62.8% | 58.2% |
| Mean | 51.8% | 49.4% |
| Median | 52.0% | 48.9% |
| Interquartile 25% (IQ1) | 47.9% | 44.3% |
| Interquartile 75% (IQ3) | 56.6% | 53.9% |
| Interquartile Range (IQR) | 8.7% | 9.5% |
| Standard Deviation (Sample) | 9.5% | 8.9% |
| Standard Deviation (Population) | 9.4% | 8.9% |
Similar Demographics by Currently Married
Demographics Similar to Finns by Currently Married
In terms of currently married, the demographic groups most similar to Finns are Scotch-Irish (48.7%, a difference of 0.010%), Immigrants from North America (48.7%, a difference of 0.040%), Greek (48.8%, a difference of 0.050%), Immigrants from Canada (48.8%, a difference of 0.060%), and Belgian (48.7%, a difference of 0.060%).
| Demographics | Rating | Rank | Currently Married |
| Immigrants | Northern Europe | 99.4 /100 | #35 | Exceptional 48.8% |
| Italians | 99.4 /100 | #36 | Exceptional 48.8% |
| Hungarians | 99.4 /100 | #37 | Exceptional 48.8% |
| Czechoslovakians | 99.4 /100 | #38 | Exceptional 48.8% |
| British | 99.4 /100 | #39 | Exceptional 48.8% |
| Immigrants | Canada | 99.4 /100 | #40 | Exceptional 48.8% |
| Greeks | 99.3 /100 | #41 | Exceptional 48.8% |
| Finns | 99.3 /100 | #42 | Exceptional 48.8% |
| Scotch-Irish | 99.3 /100 | #43 | Exceptional 48.7% |
| Immigrants | North America | 99.3 /100 | #44 | Exceptional 48.7% |
| Belgians | 99.3 /100 | #45 | Exceptional 48.7% |
| Immigrants | Iran | 99.2 /100 | #46 | Exceptional 48.7% |
| Northern Europeans | 99.2 /100 | #47 | Exceptional 48.7% |
| Austrians | 99.2 /100 | #48 | Exceptional 48.7% |
| Bhutanese | 99.1 /100 | #49 | Exceptional 48.6% |
Demographics Similar to Portuguese by Currently Married
In terms of currently married, the demographic groups most similar to Portuguese are New Zealander (47.4%, a difference of 0.040%), Immigrants from Jordan (47.4%, a difference of 0.050%), Sri Lankan (47.3%, a difference of 0.060%), Okinawan (47.4%, a difference of 0.080%), and Immigrants from Iraq (47.3%, a difference of 0.090%).
| Demographics | Rating | Rank | Currently Married |
| Immigrants | Croatia | 88.6 /100 | #121 | Excellent 47.5% |
| Osage | 87.9 /100 | #122 | Excellent 47.5% |
| Immigrants | Kazakhstan | 87.2 /100 | #123 | Excellent 47.4% |
| Laotians | 86.6 /100 | #124 | Excellent 47.4% |
| Okinawans | 85.3 /100 | #125 | Excellent 47.4% |
| Immigrants | Jordan | 84.9 /100 | #126 | Excellent 47.4% |
| New Zealanders | 84.9 /100 | #127 | Excellent 47.4% |
| Portuguese | 84.2 /100 | #128 | Excellent 47.3% |
| Sri Lankans | 83.2 /100 | #129 | Excellent 47.3% |
| Immigrants | Iraq | 82.8 /100 | #130 | Excellent 47.3% |
| Icelanders | 82.4 /100 | #131 | Excellent 47.3% |
| Afghans | 81.8 /100 | #132 | Excellent 47.3% |
| Immigrants | Malaysia | 81.1 /100 | #133 | Excellent 47.3% |
| Immigrants | Australia | 81.1 /100 | #134 | Excellent 47.3% |
| Immigrants | Norway | 79.7 /100 | #135 | Good 47.2% |