Welsh vs Immigrants from Belize Currently Married
COMPARE
Welsh
Immigrants from Belize
Currently Married
Currently Married Comparison
Welsh
Immigrants from Belize
48.9%
CURRENTLY MARRIED
99.5/ 100
METRIC RATING
28th/ 347
METRIC RANK
41.8%
CURRENTLY MARRIED
0.0/ 100
METRIC RATING
308th/ 347
METRIC RANK
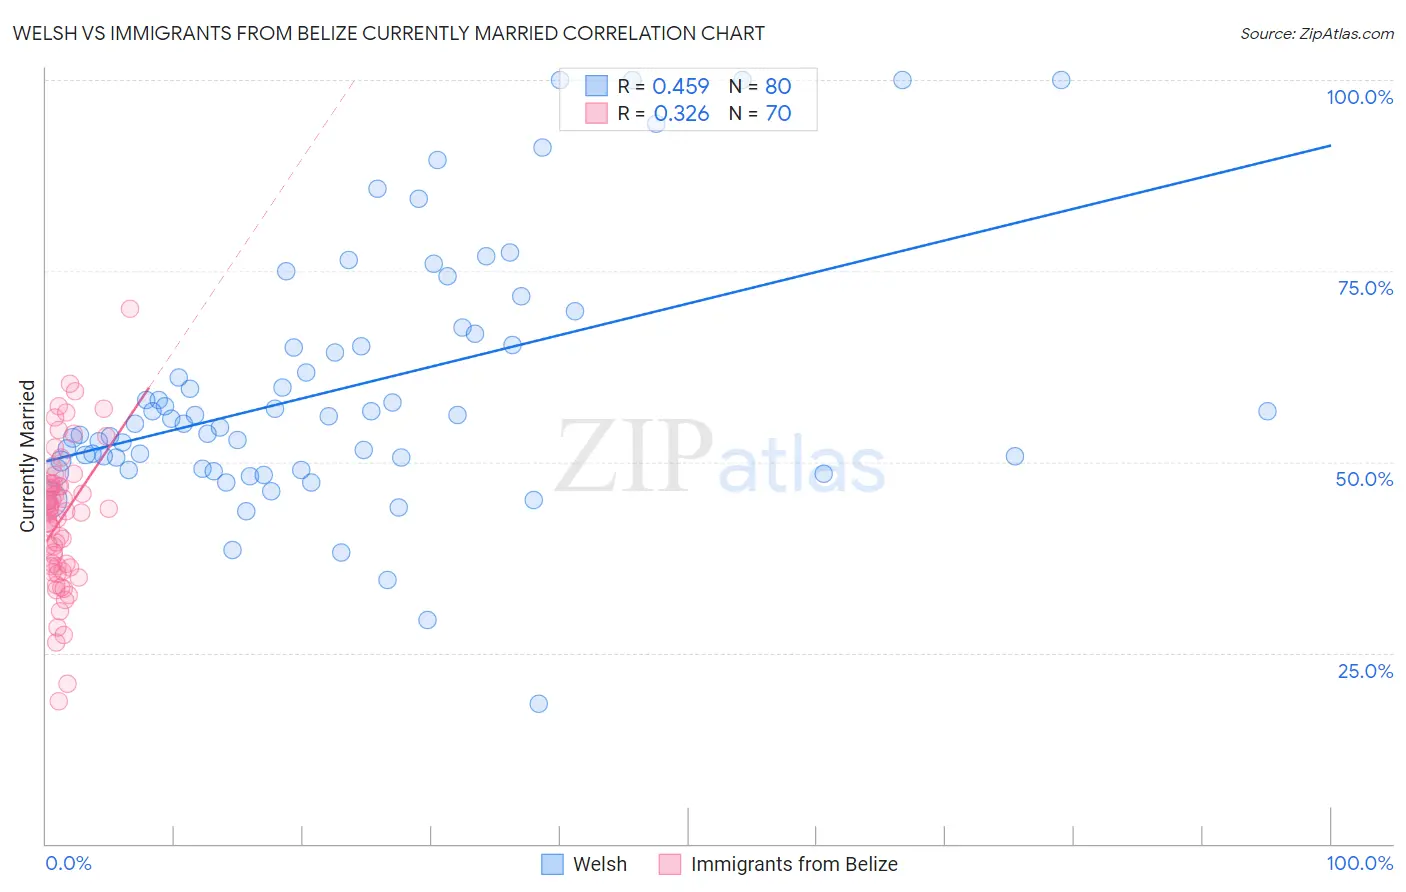
Welsh vs Immigrants from Belize Currently Married Correlation Chart
The statistical analysis conducted on geographies consisting of 528,516,985 people shows a moderate positive correlation between the proportion of Welsh and percentage of population currently married in the United States with a correlation coefficient (R) of 0.459 and weighted average of 48.9%. Similarly, the statistical analysis conducted on geographies consisting of 130,322,630 people shows a mild positive correlation between the proportion of Immigrants from Belize and percentage of population currently married in the United States with a correlation coefficient (R) of 0.326 and weighted average of 41.8%, a difference of 17.0%.
Currently Married Correlation Summary
| Measurement | Welsh | Immigrants from Belize |
| Minimum | 18.4% | 18.6% |
| Maximum | 100.0% | 70.1% |
| Range | 81.6% | 51.5% |
| Mean | 59.7% | 42.6% |
| Median | 55.4% | 43.4% |
| Interquartile 25% (IQ1) | 49.6% | 36.4% |
| Interquartile 75% (IQ3) | 66.0% | 47.1% |
| Interquartile Range (IQR) | 16.4% | 10.7% |
| Standard Deviation (Sample) | 16.8% | 9.2% |
| Standard Deviation (Population) | 16.7% | 9.2% |
Similar Demographics by Currently Married
Demographics Similar to Welsh by Currently Married
In terms of currently married, the demographic groups most similar to Welsh are Burmese (48.9%, a difference of 0.040%), Croatian (48.9%, a difference of 0.050%), Eastern European (48.9%, a difference of 0.060%), Polish (48.9%, a difference of 0.060%), and Immigrants from Hong Kong (48.9%, a difference of 0.070%).
| Demographics | Rating | Rank | Currently Married |
| Scottish | 99.8 /100 | #21 | Exceptional 49.2% |
| Bulgarians | 99.7 /100 | #22 | Exceptional 49.1% |
| Immigrants | Pakistan | 99.7 /100 | #23 | Exceptional 49.1% |
| Lithuanians | 99.6 /100 | #24 | Exceptional 49.0% |
| Maltese | 99.6 /100 | #25 | Exceptional 49.0% |
| Immigrants | Korea | 99.6 /100 | #26 | Exceptional 49.0% |
| Burmese | 99.6 /100 | #27 | Exceptional 48.9% |
| Welsh | 99.5 /100 | #28 | Exceptional 48.9% |
| Croatians | 99.5 /100 | #29 | Exceptional 48.9% |
| Eastern Europeans | 99.5 /100 | #30 | Exceptional 48.9% |
| Poles | 99.5 /100 | #31 | Exceptional 48.9% |
| Immigrants | Hong Kong | 99.5 /100 | #32 | Exceptional 48.9% |
| Irish | 99.5 /100 | #33 | Exceptional 48.9% |
| Immigrants | Lithuania | 99.4 /100 | #34 | Exceptional 48.8% |
| Immigrants | Northern Europe | 99.4 /100 | #35 | Exceptional 48.8% |
Demographics Similar to Immigrants from Belize by Currently Married
In terms of currently married, the demographic groups most similar to Immigrants from Belize are African (41.8%, a difference of 0.040%), Immigrants from Liberia (41.8%, a difference of 0.11%), Immigrants from Guyana (41.9%, a difference of 0.17%), Immigrants from Trinidad and Tobago (41.9%, a difference of 0.18%), and Immigrants from Bahamas (41.9%, a difference of 0.22%).
| Demographics | Rating | Rank | Currently Married |
| Immigrants | Yemen | 0.0 /100 | #301 | Tragic 42.1% |
| Immigrants | Zaire | 0.0 /100 | #302 | Tragic 42.0% |
| Sioux | 0.0 /100 | #303 | Tragic 41.9% |
| Immigrants | Bahamas | 0.0 /100 | #304 | Tragic 41.9% |
| Immigrants | Trinidad and Tobago | 0.0 /100 | #305 | Tragic 41.9% |
| Immigrants | Guyana | 0.0 /100 | #306 | Tragic 41.9% |
| Africans | 0.0 /100 | #307 | Tragic 41.8% |
| Immigrants | Belize | 0.0 /100 | #308 | Tragic 41.8% |
| Immigrants | Liberia | 0.0 /100 | #309 | Tragic 41.8% |
| Guyanese | 0.0 /100 | #310 | Tragic 41.6% |
| Trinidadians and Tobagonians | 0.0 /100 | #311 | Tragic 41.5% |
| Somalis | 0.0 /100 | #312 | Tragic 41.5% |
| Jamaicans | 0.0 /100 | #313 | Tragic 41.4% |
| West Indians | 0.0 /100 | #314 | Tragic 41.3% |
| Inupiat | 0.0 /100 | #315 | Tragic 41.3% |