French Canadian vs Immigrants from Belize Currently Married
COMPARE
French Canadian
Immigrants from Belize
Currently Married
Currently Married Comparison
French Canadians
Immigrants from Belize
48.0%
CURRENTLY MARRIED
96.3/ 100
METRIC RATING
85th/ 347
METRIC RANK
41.8%
CURRENTLY MARRIED
0.0/ 100
METRIC RATING
308th/ 347
METRIC RANK
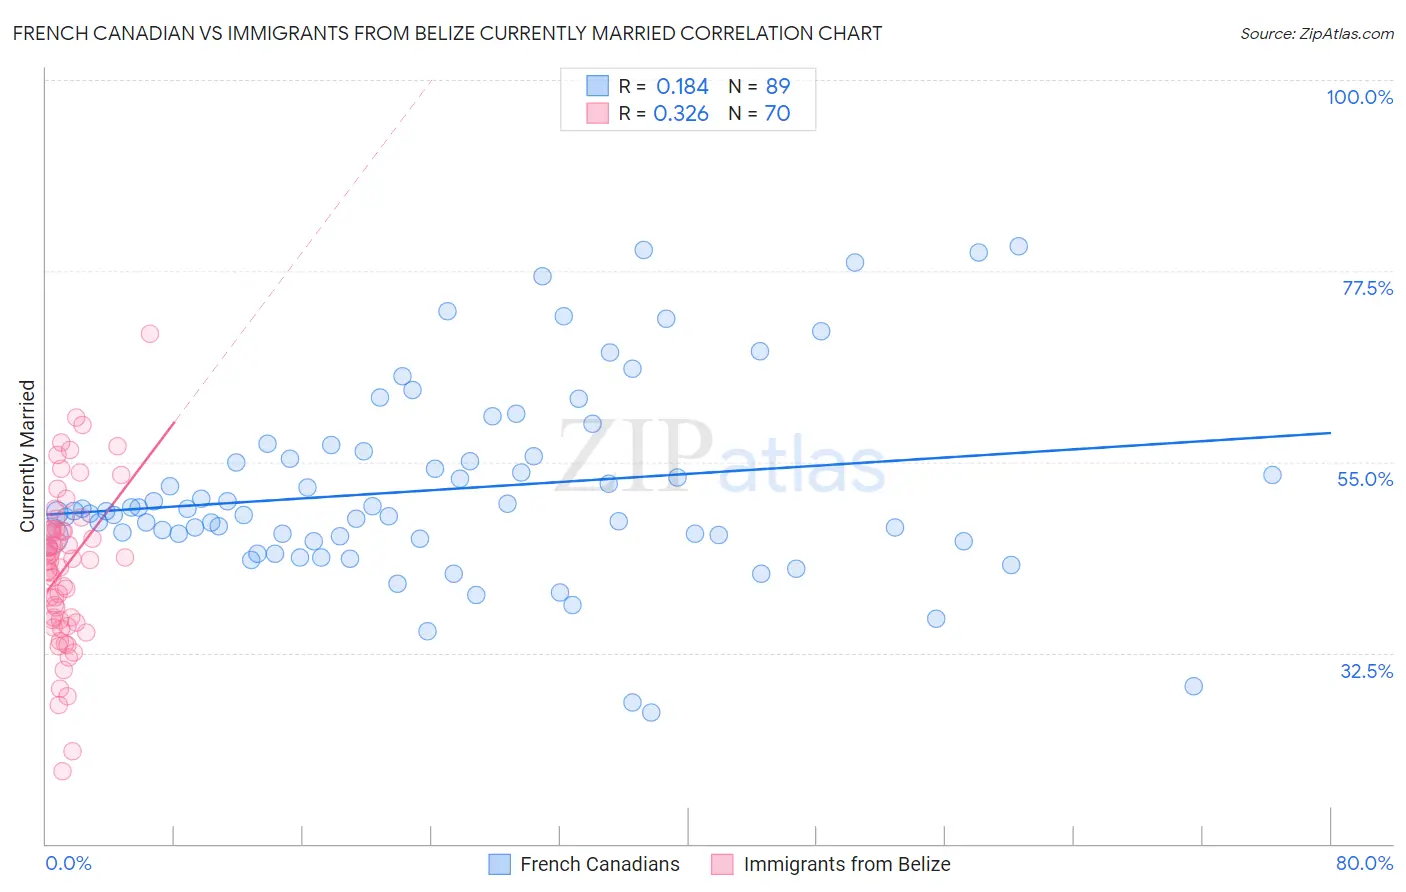
French Canadian vs Immigrants from Belize Currently Married Correlation Chart
The statistical analysis conducted on geographies consisting of 502,604,135 people shows a poor positive correlation between the proportion of French Canadians and percentage of population currently married in the United States with a correlation coefficient (R) of 0.184 and weighted average of 48.0%. Similarly, the statistical analysis conducted on geographies consisting of 130,322,630 people shows a mild positive correlation between the proportion of Immigrants from Belize and percentage of population currently married in the United States with a correlation coefficient (R) of 0.326 and weighted average of 41.8%, a difference of 14.9%.
Currently Married Correlation Summary
| Measurement | French Canadian | Immigrants from Belize |
| Minimum | 25.4% | 18.6% |
| Maximum | 80.4% | 70.1% |
| Range | 55.0% | 51.5% |
| Mean | 51.8% | 42.6% |
| Median | 49.2% | 43.4% |
| Interquartile 25% (IQ1) | 46.0% | 36.4% |
| Interquartile 75% (IQ3) | 55.9% | 47.1% |
| Interquartile Range (IQR) | 9.9% | 10.7% |
| Standard Deviation (Sample) | 11.3% | 9.2% |
| Standard Deviation (Population) | 11.3% | 9.2% |
Similar Demographics by Currently Married
Demographics Similar to French Canadians by Currently Married
In terms of currently married, the demographic groups most similar to French Canadians are Immigrants from Japan (48.0%, a difference of 0.030%), Jordanian (48.0%, a difference of 0.040%), Immigrants from Eastern Europe (48.0%, a difference of 0.060%), Indian (Asian) (48.0%, a difference of 0.12%), and Bolivian (48.1%, a difference of 0.14%).
| Demographics | Rating | Rank | Currently Married |
| Immigrants | Belgium | 97.1 /100 | #78 | Exceptional 48.1% |
| Immigrants | South Africa | 97.0 /100 | #79 | Exceptional 48.1% |
| Immigrants | Poland | 96.9 /100 | #80 | Exceptional 48.1% |
| Immigrants | Sri Lanka | 96.9 /100 | #81 | Exceptional 48.1% |
| Immigrants | Europe | 96.9 /100 | #82 | Exceptional 48.1% |
| Bolivians | 96.9 /100 | #83 | Exceptional 48.1% |
| Immigrants | Israel | 96.9 /100 | #84 | Exceptional 48.1% |
| French Canadians | 96.3 /100 | #85 | Exceptional 48.0% |
| Immigrants | Japan | 96.2 /100 | #86 | Exceptional 48.0% |
| Jordanians | 96.2 /100 | #87 | Exceptional 48.0% |
| Immigrants | Eastern Europe | 96.1 /100 | #88 | Exceptional 48.0% |
| Indians (Asian) | 95.8 /100 | #89 | Exceptional 48.0% |
| Americans | 95.7 /100 | #90 | Exceptional 48.0% |
| Immigrants | Bolivia | 95.6 /100 | #91 | Exceptional 47.9% |
| Koreans | 95.4 /100 | #92 | Exceptional 47.9% |
Demographics Similar to Immigrants from Belize by Currently Married
In terms of currently married, the demographic groups most similar to Immigrants from Belize are African (41.8%, a difference of 0.040%), Immigrants from Liberia (41.8%, a difference of 0.11%), Immigrants from Guyana (41.9%, a difference of 0.17%), Immigrants from Trinidad and Tobago (41.9%, a difference of 0.18%), and Immigrants from Bahamas (41.9%, a difference of 0.22%).
| Demographics | Rating | Rank | Currently Married |
| Immigrants | Yemen | 0.0 /100 | #301 | Tragic 42.1% |
| Immigrants | Zaire | 0.0 /100 | #302 | Tragic 42.0% |
| Sioux | 0.0 /100 | #303 | Tragic 41.9% |
| Immigrants | Bahamas | 0.0 /100 | #304 | Tragic 41.9% |
| Immigrants | Trinidad and Tobago | 0.0 /100 | #305 | Tragic 41.9% |
| Immigrants | Guyana | 0.0 /100 | #306 | Tragic 41.9% |
| Africans | 0.0 /100 | #307 | Tragic 41.8% |
| Immigrants | Belize | 0.0 /100 | #308 | Tragic 41.8% |
| Immigrants | Liberia | 0.0 /100 | #309 | Tragic 41.8% |
| Guyanese | 0.0 /100 | #310 | Tragic 41.6% |
| Trinidadians and Tobagonians | 0.0 /100 | #311 | Tragic 41.5% |
| Somalis | 0.0 /100 | #312 | Tragic 41.5% |
| Jamaicans | 0.0 /100 | #313 | Tragic 41.4% |
| West Indians | 0.0 /100 | #314 | Tragic 41.3% |
| Inupiat | 0.0 /100 | #315 | Tragic 41.3% |