Immigrants from France vs Immigrants from Belize Currently Married
COMPARE
Immigrants from France
Immigrants from Belize
Currently Married
Currently Married Comparison
Immigrants from France
Immigrants from Belize
46.2%
CURRENTLY MARRIED
27.7/ 100
METRIC RATING
191st/ 347
METRIC RANK
41.8%
CURRENTLY MARRIED
0.0/ 100
METRIC RATING
308th/ 347
METRIC RANK
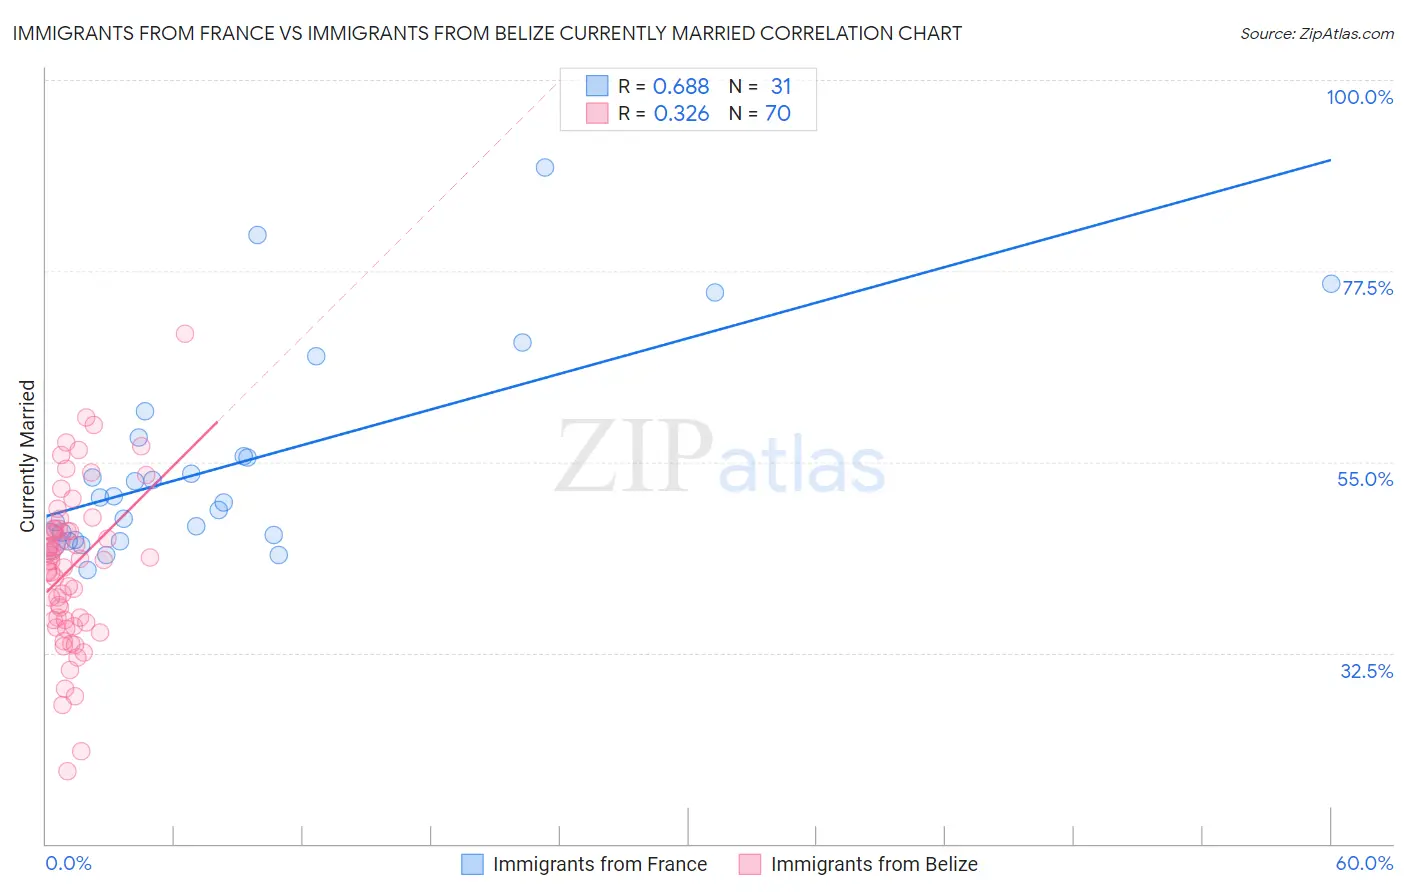
Immigrants from France vs Immigrants from Belize Currently Married Correlation Chart
The statistical analysis conducted on geographies consisting of 287,900,584 people shows a significant positive correlation between the proportion of Immigrants from France and percentage of population currently married in the United States with a correlation coefficient (R) of 0.688 and weighted average of 46.2%. Similarly, the statistical analysis conducted on geographies consisting of 130,322,630 people shows a mild positive correlation between the proportion of Immigrants from Belize and percentage of population currently married in the United States with a correlation coefficient (R) of 0.326 and weighted average of 41.8%, a difference of 10.6%.
Currently Married Correlation Summary
| Measurement | Immigrants from France | Immigrants from Belize |
| Minimum | 42.2% | 18.6% |
| Maximum | 89.7% | 70.1% |
| Range | 47.5% | 51.5% |
| Mean | 54.8% | 42.6% |
| Median | 50.8% | 43.4% |
| Interquartile 25% (IQ1) | 45.8% | 36.4% |
| Interquartile 75% (IQ3) | 57.9% | 47.1% |
| Interquartile Range (IQR) | 12.1% | 10.7% |
| Standard Deviation (Sample) | 12.1% | 9.2% |
| Standard Deviation (Population) | 11.9% | 9.2% |
Similar Demographics by Currently Married
Demographics Similar to Immigrants from France by Currently Married
In terms of currently married, the demographic groups most similar to Immigrants from France are Choctaw (46.3%, a difference of 0.060%), Soviet Union (46.2%, a difference of 0.090%), Fijian (46.3%, a difference of 0.12%), Immigrants from Fiji (46.2%, a difference of 0.13%), and Colombian (46.3%, a difference of 0.18%).
| Demographics | Rating | Rank | Currently Married |
| Brazilians | 39.3 /100 | #184 | Fair 46.4% |
| Mongolians | 37.6 /100 | #185 | Fair 46.4% |
| Immigrants | Chile | 36.8 /100 | #186 | Fair 46.4% |
| Immigrants | Peru | 35.3 /100 | #187 | Fair 46.4% |
| Colombians | 31.8 /100 | #188 | Fair 46.3% |
| Fijians | 30.3 /100 | #189 | Fair 46.3% |
| Choctaw | 29.1 /100 | #190 | Fair 46.3% |
| Immigrants | France | 27.7 /100 | #191 | Fair 46.2% |
| Soviet Union | 25.7 /100 | #192 | Fair 46.2% |
| Immigrants | Fiji | 25.0 /100 | #193 | Fair 46.2% |
| South Americans | 23.8 /100 | #194 | Fair 46.1% |
| Immigrants | Nepal | 23.7 /100 | #195 | Fair 46.1% |
| Immigrants | Bosnia and Herzegovina | 22.2 /100 | #196 | Fair 46.1% |
| Immigrants | Kuwait | 21.7 /100 | #197 | Fair 46.1% |
| Immigrants | Colombia | 21.0 /100 | #198 | Fair 46.1% |
Demographics Similar to Immigrants from Belize by Currently Married
In terms of currently married, the demographic groups most similar to Immigrants from Belize are African (41.8%, a difference of 0.040%), Immigrants from Liberia (41.8%, a difference of 0.11%), Immigrants from Guyana (41.9%, a difference of 0.17%), Immigrants from Trinidad and Tobago (41.9%, a difference of 0.18%), and Immigrants from Bahamas (41.9%, a difference of 0.22%).
| Demographics | Rating | Rank | Currently Married |
| Immigrants | Yemen | 0.0 /100 | #301 | Tragic 42.1% |
| Immigrants | Zaire | 0.0 /100 | #302 | Tragic 42.0% |
| Sioux | 0.0 /100 | #303 | Tragic 41.9% |
| Immigrants | Bahamas | 0.0 /100 | #304 | Tragic 41.9% |
| Immigrants | Trinidad and Tobago | 0.0 /100 | #305 | Tragic 41.9% |
| Immigrants | Guyana | 0.0 /100 | #306 | Tragic 41.9% |
| Africans | 0.0 /100 | #307 | Tragic 41.8% |
| Immigrants | Belize | 0.0 /100 | #308 | Tragic 41.8% |
| Immigrants | Liberia | 0.0 /100 | #309 | Tragic 41.8% |
| Guyanese | 0.0 /100 | #310 | Tragic 41.6% |
| Trinidadians and Tobagonians | 0.0 /100 | #311 | Tragic 41.5% |
| Somalis | 0.0 /100 | #312 | Tragic 41.5% |
| Jamaicans | 0.0 /100 | #313 | Tragic 41.4% |
| West Indians | 0.0 /100 | #314 | Tragic 41.3% |
| Inupiat | 0.0 /100 | #315 | Tragic 41.3% |