Finnish vs Immigrants from Belize 7th Grade
COMPARE
Finnish
Immigrants from Belize
7th Grade
7th Grade Comparison
Finns
Immigrants from Belize
98.5%
7TH GRADE
100.0/ 100
METRIC RATING
2nd/ 347
METRIC RANK
93.4%
7TH GRADE
0.0/ 100
METRIC RATING
323rd/ 347
METRIC RANK
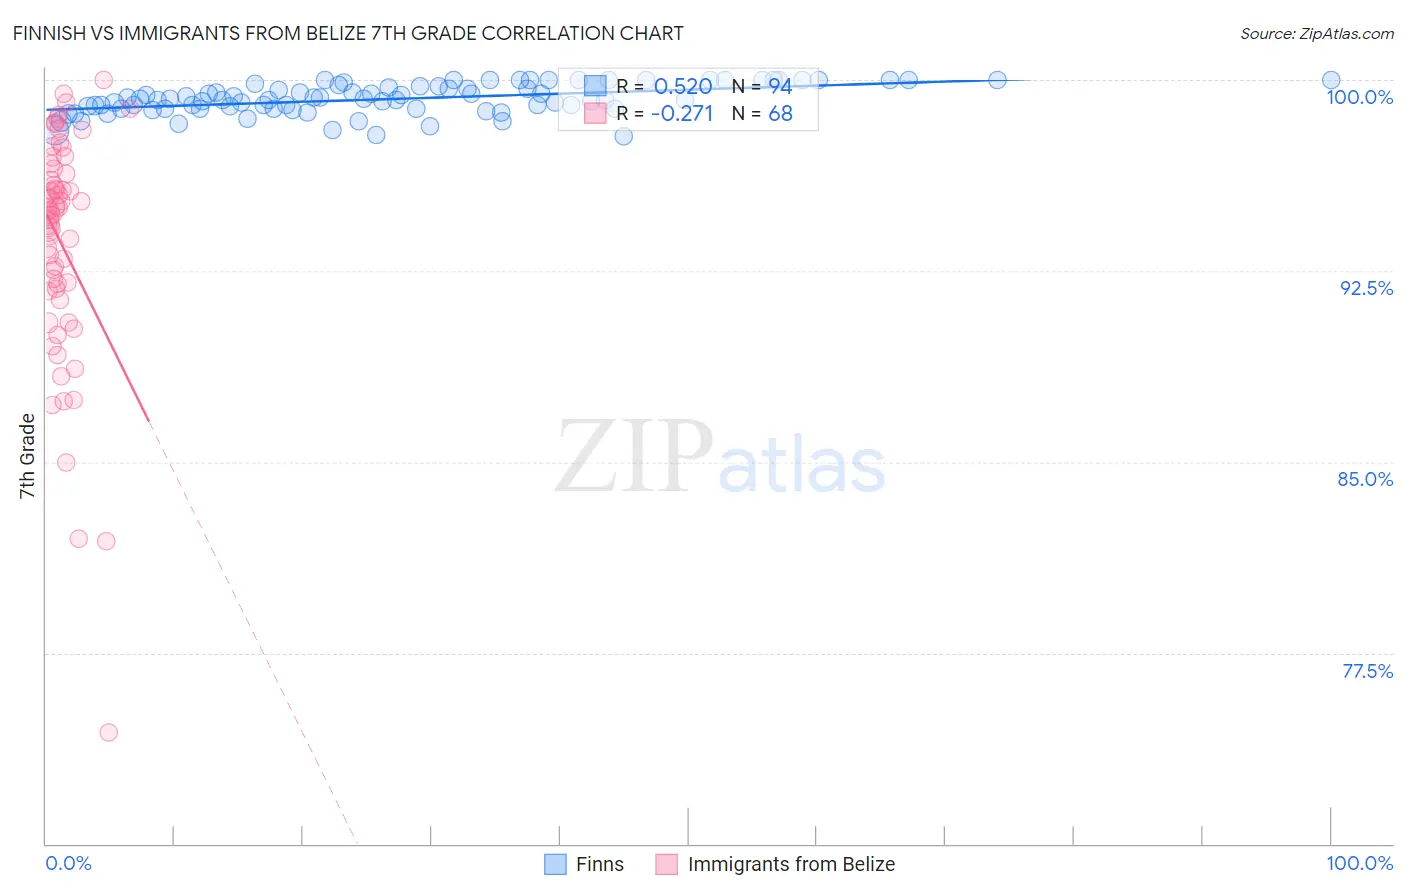
Finnish vs Immigrants from Belize 7th Grade Correlation Chart
The statistical analysis conducted on geographies consisting of 46,909,556 people shows a substantial positive correlation between the proportion of Finns and percentage of population with at least 7th grade education in the United States with a correlation coefficient (R) of 0.520 and weighted average of 98.5%. Similarly, the statistical analysis conducted on geographies consisting of 130,181,087 people shows a weak negative correlation between the proportion of Immigrants from Belize and percentage of population with at least 7th grade education in the United States with a correlation coefficient (R) of -0.271 and weighted average of 93.4%, a difference of 5.5%.
7th Grade Correlation Summary
| Measurement | Finnish | Immigrants from Belize |
| Minimum | 97.8% | 74.3% |
| Maximum | 100.0% | 100.0% |
| Range | 2.2% | 25.7% |
| Mean | 99.3% | 93.6% |
| Median | 99.2% | 94.9% |
| Interquartile 25% (IQ1) | 98.9% | 91.8% |
| Interquartile 75% (IQ3) | 99.7% | 96.4% |
| Interquartile Range (IQR) | 0.85% | 4.7% |
| Standard Deviation (Sample) | 0.57% | 4.6% |
| Standard Deviation (Population) | 0.57% | 4.5% |
Similar Demographics by 7th Grade
Demographics Similar to Finns by 7th Grade
In terms of 7th grade, the demographic groups most similar to Finns are Carpatho Rusyn (98.3%, a difference of 0.18%), Ottawa (98.1%, a difference of 0.37%), Dutch (97.9%, a difference of 0.64%), Crow (99.1%, a difference of 0.65%), and Tsimshian (97.8%, a difference of 0.71%).
| Demographics | Rating | Rank | 7th Grade |
| Crow | 100.0 /100 | #1 | Exceptional 99.1% |
| Finns | 100.0 /100 | #2 | Exceptional 98.5% |
| Carpatho Rusyns | 100.0 /100 | #3 | Exceptional 98.3% |
| Ottawa | 100.0 /100 | #4 | Exceptional 98.1% |
| Dutch | 100.0 /100 | #5 | Exceptional 97.9% |
| Tsimshian | 100.0 /100 | #6 | Exceptional 97.8% |
| Norwegians | 100.0 /100 | #7 | Exceptional 97.8% |
| Slovaks | 100.0 /100 | #8 | Exceptional 97.8% |
| Germans | 100.0 /100 | #9 | Exceptional 97.7% |
| Slovenes | 100.0 /100 | #10 | Exceptional 97.6% |
| Alaskan Athabascans | 100.0 /100 | #11 | Exceptional 97.6% |
| Poles | 100.0 /100 | #12 | Exceptional 97.6% |
| Swedes | 100.0 /100 | #13 | Exceptional 97.6% |
| Pennsylvania Germans | 100.0 /100 | #14 | Exceptional 97.6% |
| English | 100.0 /100 | #15 | Exceptional 97.6% |
Demographics Similar to Immigrants from Belize by 7th Grade
In terms of 7th grade, the demographic groups most similar to Immigrants from Belize are Dominican (93.3%, a difference of 0.020%), Central American Indian (93.3%, a difference of 0.080%), Nicaraguan (93.5%, a difference of 0.11%), Belizean (93.5%, a difference of 0.15%), and Immigrants from Fiji (93.5%, a difference of 0.19%).
| Demographics | Rating | Rank | 7th Grade |
| Immigrants | Vietnam | 0.0 /100 | #316 | Tragic 93.9% |
| Immigrants | Cuba | 0.0 /100 | #317 | Tragic 93.8% |
| Immigrants | Ecuador | 0.0 /100 | #318 | Tragic 93.7% |
| Immigrants | Cambodia | 0.0 /100 | #319 | Tragic 93.7% |
| Immigrants | Fiji | 0.0 /100 | #320 | Tragic 93.5% |
| Belizeans | 0.0 /100 | #321 | Tragic 93.5% |
| Nicaraguans | 0.0 /100 | #322 | Tragic 93.5% |
| Immigrants | Belize | 0.0 /100 | #323 | Tragic 93.4% |
| Dominicans | 0.0 /100 | #324 | Tragic 93.3% |
| Central American Indians | 0.0 /100 | #325 | Tragic 93.3% |
| Nepalese | 0.0 /100 | #326 | Tragic 93.2% |
| Immigrants | Cabo Verde | 0.0 /100 | #327 | Tragic 93.1% |
| Immigrants | Nicaragua | 0.0 /100 | #328 | Tragic 93.0% |
| Immigrants | Azores | 0.0 /100 | #329 | Tragic 93.0% |
| Immigrants | Dominican Republic | 0.0 /100 | #330 | Tragic 92.9% |