Immigrants from Cabo Verde vs Immigrants from Belize Currently Married
COMPARE
Immigrants from Cabo Verde
Immigrants from Belize
Currently Married
Currently Married Comparison
Immigrants from Cabo Verde
Immigrants from Belize
37.8%
CURRENTLY MARRIED
0.0/ 100
METRIC RATING
344th/ 347
METRIC RANK
41.8%
CURRENTLY MARRIED
0.0/ 100
METRIC RATING
308th/ 347
METRIC RANK
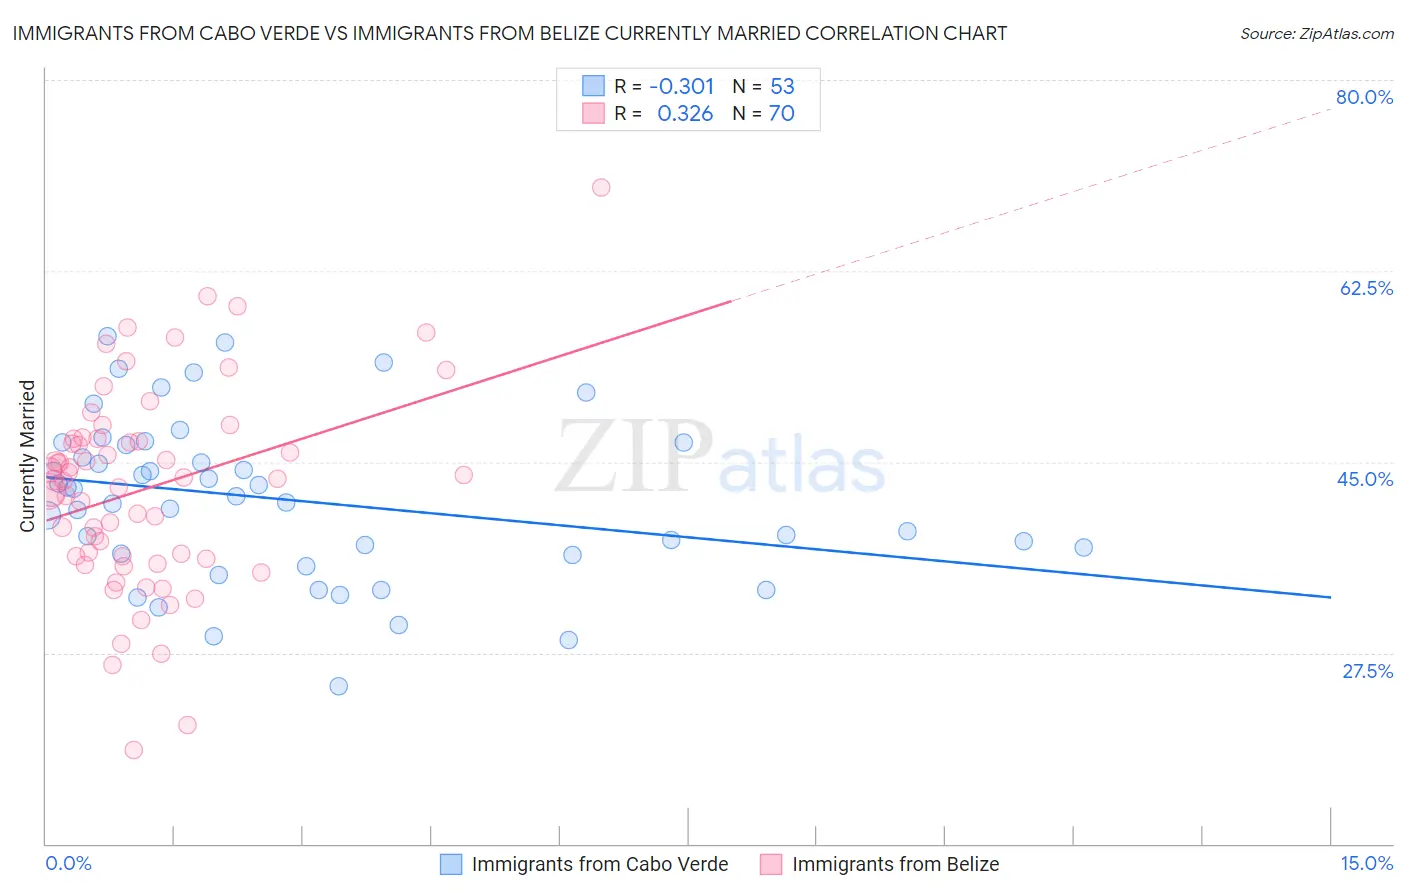
Immigrants from Cabo Verde vs Immigrants from Belize Currently Married Correlation Chart
The statistical analysis conducted on geographies consisting of 38,158,666 people shows a mild negative correlation between the proportion of Immigrants from Cabo Verde and percentage of population currently married in the United States with a correlation coefficient (R) of -0.301 and weighted average of 37.8%. Similarly, the statistical analysis conducted on geographies consisting of 130,322,630 people shows a mild positive correlation between the proportion of Immigrants from Belize and percentage of population currently married in the United States with a correlation coefficient (R) of 0.326 and weighted average of 41.8%, a difference of 10.5%.
Currently Married Correlation Summary
| Measurement | Immigrants from Cabo Verde | Immigrants from Belize |
| Minimum | 24.4% | 18.6% |
| Maximum | 56.5% | 70.1% |
| Range | 32.1% | 51.5% |
| Mean | 41.5% | 42.6% |
| Median | 41.9% | 43.4% |
| Interquartile 25% (IQ1) | 36.6% | 36.4% |
| Interquartile 75% (IQ3) | 46.7% | 47.1% |
| Interquartile Range (IQR) | 10.1% | 10.7% |
| Standard Deviation (Sample) | 7.4% | 9.2% |
| Standard Deviation (Population) | 7.3% | 9.2% |
Similar Demographics by Currently Married
Demographics Similar to Immigrants from Cabo Verde by Currently Married
In terms of currently married, the demographic groups most similar to Immigrants from Cabo Verde are Pueblo (38.2%, a difference of 1.1%), Tohono O'odham (36.8%, a difference of 2.9%), Immigrants from Dominican Republic (38.9%, a difference of 2.9%), Navajo (39.0%, a difference of 3.1%), and Immigrants from Grenada (39.1%, a difference of 3.5%).
| Demographics | Rating | Rank | Currently Married |
| Yup'ik | 0.0 /100 | #333 | Tragic 39.9% |
| Puerto Ricans | 0.0 /100 | #334 | Tragic 39.9% |
| Lumbee | 0.0 /100 | #335 | Tragic 39.8% |
| British West Indians | 0.0 /100 | #336 | Tragic 39.8% |
| Blacks/African Americans | 0.0 /100 | #337 | Tragic 39.6% |
| Cape Verdeans | 0.0 /100 | #338 | Tragic 39.6% |
| Dominicans | 0.0 /100 | #339 | Tragic 39.5% |
| Immigrants | Grenada | 0.0 /100 | #340 | Tragic 39.1% |
| Navajo | 0.0 /100 | #341 | Tragic 39.0% |
| Immigrants | Dominican Republic | 0.0 /100 | #342 | Tragic 38.9% |
| Pueblo | 0.0 /100 | #343 | Tragic 38.2% |
| Immigrants | Cabo Verde | 0.0 /100 | #344 | Tragic 37.8% |
| Tohono O'odham | 0.0 /100 | #345 | Tragic 36.8% |
| Hopi | 0.0 /100 | #346 | Tragic 36.5% |
| Pima | 0.0 /100 | #347 | Tragic 35.9% |
Demographics Similar to Immigrants from Belize by Currently Married
In terms of currently married, the demographic groups most similar to Immigrants from Belize are African (41.8%, a difference of 0.040%), Immigrants from Liberia (41.8%, a difference of 0.11%), Immigrants from Guyana (41.9%, a difference of 0.17%), Immigrants from Trinidad and Tobago (41.9%, a difference of 0.18%), and Immigrants from Bahamas (41.9%, a difference of 0.22%).
| Demographics | Rating | Rank | Currently Married |
| Immigrants | Yemen | 0.0 /100 | #301 | Tragic 42.1% |
| Immigrants | Zaire | 0.0 /100 | #302 | Tragic 42.0% |
| Sioux | 0.0 /100 | #303 | Tragic 41.9% |
| Immigrants | Bahamas | 0.0 /100 | #304 | Tragic 41.9% |
| Immigrants | Trinidad and Tobago | 0.0 /100 | #305 | Tragic 41.9% |
| Immigrants | Guyana | 0.0 /100 | #306 | Tragic 41.9% |
| Africans | 0.0 /100 | #307 | Tragic 41.8% |
| Immigrants | Belize | 0.0 /100 | #308 | Tragic 41.8% |
| Immigrants | Liberia | 0.0 /100 | #309 | Tragic 41.8% |
| Guyanese | 0.0 /100 | #310 | Tragic 41.6% |
| Trinidadians and Tobagonians | 0.0 /100 | #311 | Tragic 41.5% |
| Somalis | 0.0 /100 | #312 | Tragic 41.5% |
| Jamaicans | 0.0 /100 | #313 | Tragic 41.4% |
| West Indians | 0.0 /100 | #314 | Tragic 41.3% |
| Inupiat | 0.0 /100 | #315 | Tragic 41.3% |