Finnish vs Immigrants from Belize Unemployment Among Seniors over 65 years
COMPARE
Finnish
Immigrants from Belize
Unemployment Among Seniors over 65 years
Unemployment Among Seniors over 65 years Comparison
Finns
Immigrants from Belize
5.0%
UNEMPLOYMENT AMONG SENIORS OVER 65 YEARS
92.2/ 100
METRIC RATING
111th/ 347
METRIC RANK
5.5%
UNEMPLOYMENT AMONG SENIORS OVER 65 YEARS
0.0/ 100
METRIC RATING
282nd/ 347
METRIC RANK
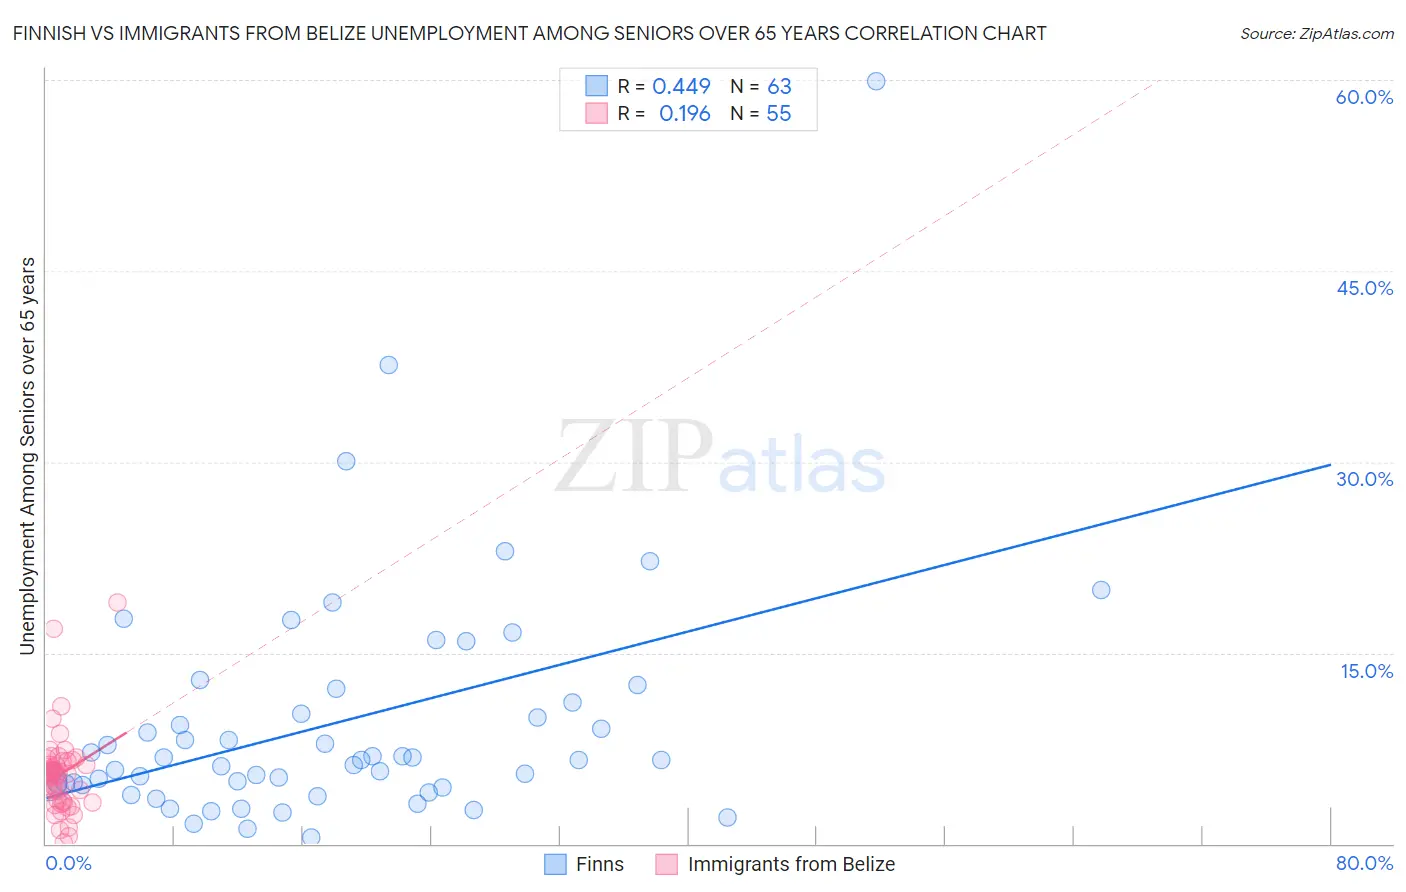
Finnish vs Immigrants from Belize Unemployment Among Seniors over 65 years Correlation Chart
The statistical analysis conducted on geographies consisting of 356,249,790 people shows a moderate positive correlation between the proportion of Finns and unemployment rate amomg seniors over the age of 65 in the United States with a correlation coefficient (R) of 0.449 and weighted average of 5.0%. Similarly, the statistical analysis conducted on geographies consisting of 125,826,150 people shows a poor positive correlation between the proportion of Immigrants from Belize and unemployment rate amomg seniors over the age of 65 in the United States with a correlation coefficient (R) of 0.196 and weighted average of 5.5%, a difference of 8.4%.
Unemployment Among Seniors over 65 years Correlation Summary
| Measurement | Finnish | Immigrants from Belize |
| Minimum | 0.50% | 0.10% |
| Maximum | 59.9% | 19.0% |
| Range | 59.4% | 18.9% |
| Mean | 9.5% | 5.5% |
| Median | 6.6% | 5.5% |
| Interquartile 25% (IQ1) | 4.6% | 3.3% |
| Interquartile 75% (IQ3) | 11.1% | 6.5% |
| Interquartile Range (IQR) | 6.5% | 3.2% |
| Standard Deviation (Sample) | 9.5% | 3.2% |
| Standard Deviation (Population) | 9.5% | 3.2% |
Similar Demographics by Unemployment Among Seniors over 65 years
Demographics Similar to Finns by Unemployment Among Seniors over 65 years
In terms of unemployment among seniors over 65 years, the demographic groups most similar to Finns are Eastern European (5.0%, a difference of 0.020%), Immigrants from Saudi Arabia (5.0%, a difference of 0.060%), Immigrants from Malaysia (5.0%, a difference of 0.070%), Seminole (5.0%, a difference of 0.080%), and Immigrants from Vietnam (5.0%, a difference of 0.090%).
| Demographics | Rating | Rank | Unemployment Among Seniors over 65 years |
| Immigrants | Scotland | 95.0 /100 | #104 | Exceptional 5.0% |
| Okinawans | 94.7 /100 | #105 | Exceptional 5.0% |
| Immigrants | Turkey | 94.3 /100 | #106 | Exceptional 5.0% |
| Immigrants | Germany | 93.2 /100 | #107 | Exceptional 5.0% |
| Immigrants | Vietnam | 92.9 /100 | #108 | Exceptional 5.0% |
| Immigrants | Malaysia | 92.7 /100 | #109 | Exceptional 5.0% |
| Immigrants | Saudi Arabia | 92.7 /100 | #110 | Exceptional 5.0% |
| Finns | 92.2 /100 | #111 | Exceptional 5.0% |
| Eastern Europeans | 92.0 /100 | #112 | Exceptional 5.0% |
| Seminole | 91.4 /100 | #113 | Exceptional 5.0% |
| Immigrants | Latvia | 91.4 /100 | #114 | Exceptional 5.0% |
| Celtics | 91.3 /100 | #115 | Exceptional 5.0% |
| Immigrants | Korea | 91.0 /100 | #116 | Exceptional 5.0% |
| Malaysians | 90.4 /100 | #117 | Exceptional 5.1% |
| Soviet Union | 90.1 /100 | #118 | Exceptional 5.1% |
Demographics Similar to Immigrants from Belize by Unemployment Among Seniors over 65 years
In terms of unemployment among seniors over 65 years, the demographic groups most similar to Immigrants from Belize are Immigrants from Norway (5.5%, a difference of 0.13%), Immigrants from Haiti (5.5%, a difference of 0.19%), Immigrants from South America (5.5%, a difference of 0.28%), Brazilian (5.5%, a difference of 0.31%), and Colville (5.4%, a difference of 0.43%).
| Demographics | Rating | Rank | Unemployment Among Seniors over 65 years |
| Mexican American Indians | 0.1 /100 | #275 | Tragic 5.4% |
| Pueblo | 0.1 /100 | #276 | Tragic 5.4% |
| Immigrants | Western Africa | 0.1 /100 | #277 | Tragic 5.4% |
| Colville | 0.1 /100 | #278 | Tragic 5.4% |
| Brazilians | 0.1 /100 | #279 | Tragic 5.5% |
| Immigrants | South America | 0.1 /100 | #280 | Tragic 5.5% |
| Immigrants | Norway | 0.0 /100 | #281 | Tragic 5.5% |
| Immigrants | Belize | 0.0 /100 | #282 | Tragic 5.5% |
| Immigrants | Haiti | 0.0 /100 | #283 | Tragic 5.5% |
| Immigrants | Liberia | 0.0 /100 | #284 | Tragic 5.5% |
| Central Americans | 0.0 /100 | #285 | Tragic 5.5% |
| Immigrants | Barbados | 0.0 /100 | #286 | Tragic 5.5% |
| Venezuelans | 0.0 /100 | #287 | Tragic 5.5% |
| U.S. Virgin Islanders | 0.0 /100 | #288 | Tragic 5.5% |
| Immigrants | Cabo Verde | 0.0 /100 | #289 | Tragic 5.5% |