Russian vs Tsimshian Divorced or Separated
COMPARE
Russian
Tsimshian
Divorced or Separated
Divorced or Separated Comparison
Russians
Tsimshian
11.5%
DIVORCED OR SEPARATED
99.4/ 100
METRIC RATING
81st/ 347
METRIC RANK
13.3%
DIVORCED OR SEPARATED
0.0/ 100
METRIC RATING
316th/ 347
METRIC RANK
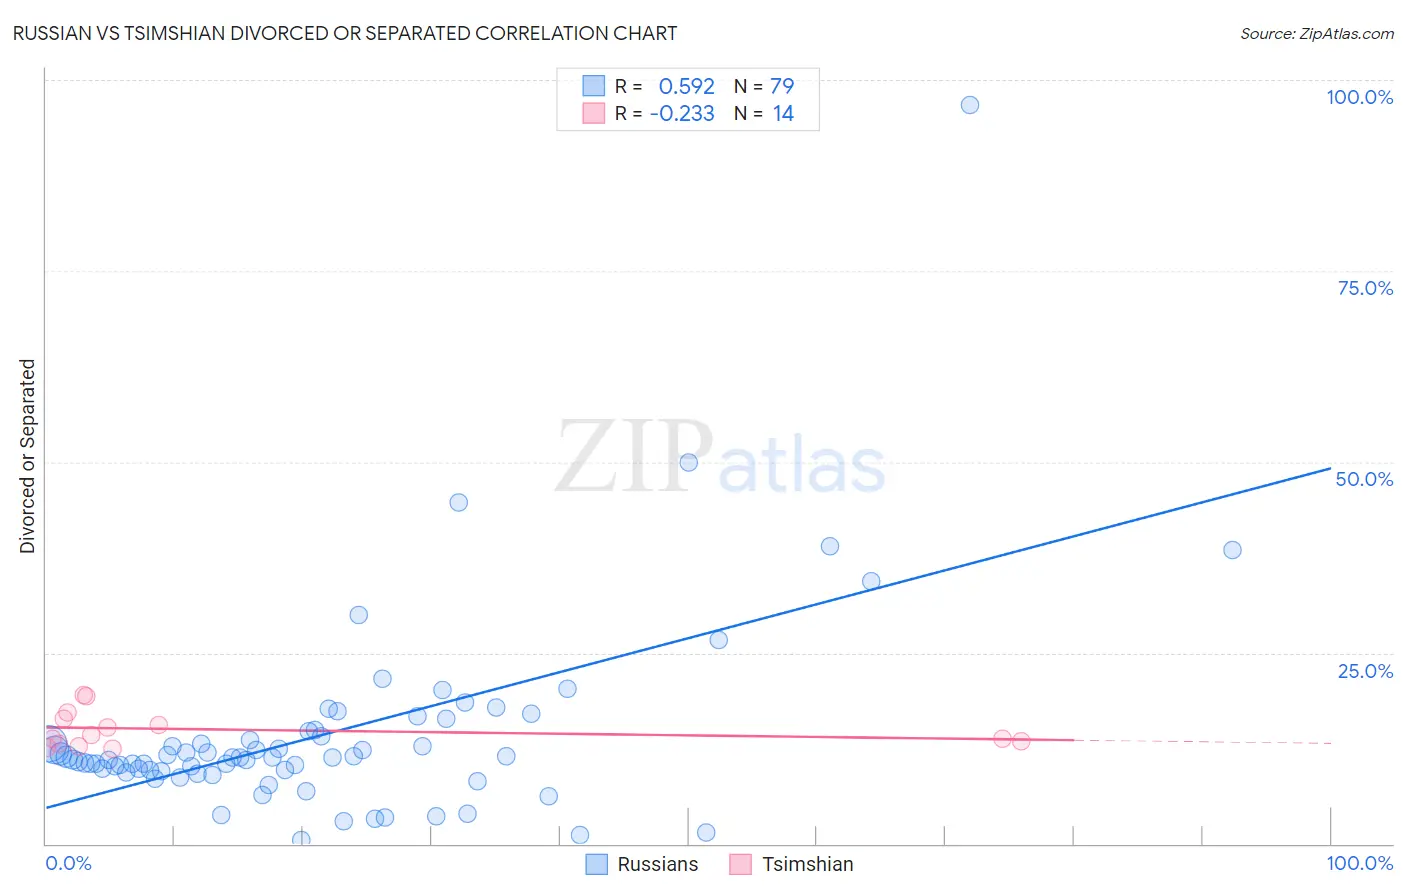
Russian vs Tsimshian Divorced or Separated Correlation Chart
The statistical analysis conducted on geographies consisting of 511,901,777 people shows a substantial positive correlation between the proportion of Russians and percentage of population currently divorced or separated in the United States with a correlation coefficient (R) of 0.592 and weighted average of 11.5%. Similarly, the statistical analysis conducted on geographies consisting of 15,626,183 people shows a weak negative correlation between the proportion of Tsimshian and percentage of population currently divorced or separated in the United States with a correlation coefficient (R) of -0.233 and weighted average of 13.3%, a difference of 15.8%.
Divorced or Separated Correlation Summary
| Measurement | Russian | Tsimshian |
| Minimum | 0.50% | 12.5% |
| Maximum | 96.8% | 19.5% |
| Range | 96.3% | 7.0% |
| Mean | 14.3% | 15.0% |
| Median | 11.3% | 14.0% |
| Interquartile 25% (IQ1) | 9.6% | 13.1% |
| Interquartile 75% (IQ3) | 14.8% | 16.3% |
| Interquartile Range (IQR) | 5.2% | 3.2% |
| Standard Deviation (Sample) | 13.0% | 2.4% |
| Standard Deviation (Population) | 12.9% | 2.3% |
Similar Demographics by Divorced or Separated
Demographics Similar to Russians by Divorced or Separated
In terms of divorced or separated, the demographic groups most similar to Russians are Immigrants from Switzerland (11.5%, a difference of 0.010%), Guyanese (11.5%, a difference of 0.030%), Afghan (11.5%, a difference of 0.070%), Immigrants from Romania (11.5%, a difference of 0.080%), and Immigrants from Bulgaria (11.5%, a difference of 0.11%).
| Demographics | Rating | Rank | Divorced or Separated |
| Taiwanese | 99.6 /100 | #74 | Exceptional 11.5% |
| Immigrants | Northern Africa | 99.6 /100 | #75 | Exceptional 11.5% |
| Albanians | 99.6 /100 | #76 | Exceptional 11.5% |
| Immigrants | Italy | 99.5 /100 | #77 | Exceptional 11.5% |
| Afghans | 99.4 /100 | #78 | Exceptional 11.5% |
| Guyanese | 99.4 /100 | #79 | Exceptional 11.5% |
| Immigrants | Switzerland | 99.4 /100 | #80 | Exceptional 11.5% |
| Russians | 99.4 /100 | #81 | Exceptional 11.5% |
| Immigrants | Romania | 99.3 /100 | #82 | Exceptional 11.5% |
| Immigrants | Bulgaria | 99.3 /100 | #83 | Exceptional 11.5% |
| Bulgarians | 99.3 /100 | #84 | Exceptional 11.5% |
| Immigrants | Albania | 99.3 /100 | #85 | Exceptional 11.5% |
| Immigrants | Latvia | 99.2 /100 | #86 | Exceptional 11.6% |
| Immigrants | Nepal | 99.2 /100 | #87 | Exceptional 11.6% |
| Immigrants | Europe | 99.2 /100 | #88 | Exceptional 11.6% |
Demographics Similar to Tsimshian by Divorced or Separated
In terms of divorced or separated, the demographic groups most similar to Tsimshian are Haitian (13.3%, a difference of 0.020%), Spanish American (13.3%, a difference of 0.030%), Cree (13.4%, a difference of 0.050%), Puget Sound Salish (13.4%, a difference of 0.080%), and Cajun (13.4%, a difference of 0.14%).
| Demographics | Rating | Rank | Divorced or Separated |
| Americans | 0.0 /100 | #309 | Tragic 13.2% |
| Africans | 0.0 /100 | #310 | Tragic 13.2% |
| Sioux | 0.0 /100 | #311 | Tragic 13.2% |
| Blackfeet | 0.0 /100 | #312 | Tragic 13.3% |
| Immigrants | Nicaragua | 0.0 /100 | #313 | Tragic 13.3% |
| Yaqui | 0.0 /100 | #314 | Tragic 13.3% |
| Spanish Americans | 0.0 /100 | #315 | Tragic 13.3% |
| Tsimshian | 0.0 /100 | #316 | Tragic 13.3% |
| Haitians | 0.0 /100 | #317 | Tragic 13.3% |
| Cree | 0.0 /100 | #318 | Tragic 13.4% |
| Puget Sound Salish | 0.0 /100 | #319 | Tragic 13.4% |
| Cajuns | 0.0 /100 | #320 | Tragic 13.4% |
| Cheyenne | 0.0 /100 | #321 | Tragic 13.4% |
| Immigrants | Haiti | 0.0 /100 | #322 | Tragic 13.4% |
| U.S. Virgin Islanders | 0.0 /100 | #323 | Tragic 13.4% |