Sioux vs Tsimshian Divorced or Separated
COMPARE
Sioux
Tsimshian
Divorced or Separated
Divorced or Separated Comparison
Sioux
Tsimshian
13.2%
DIVORCED OR SEPARATED
0.0/ 100
METRIC RATING
311th/ 347
METRIC RANK
13.3%
DIVORCED OR SEPARATED
0.0/ 100
METRIC RATING
316th/ 347
METRIC RANK
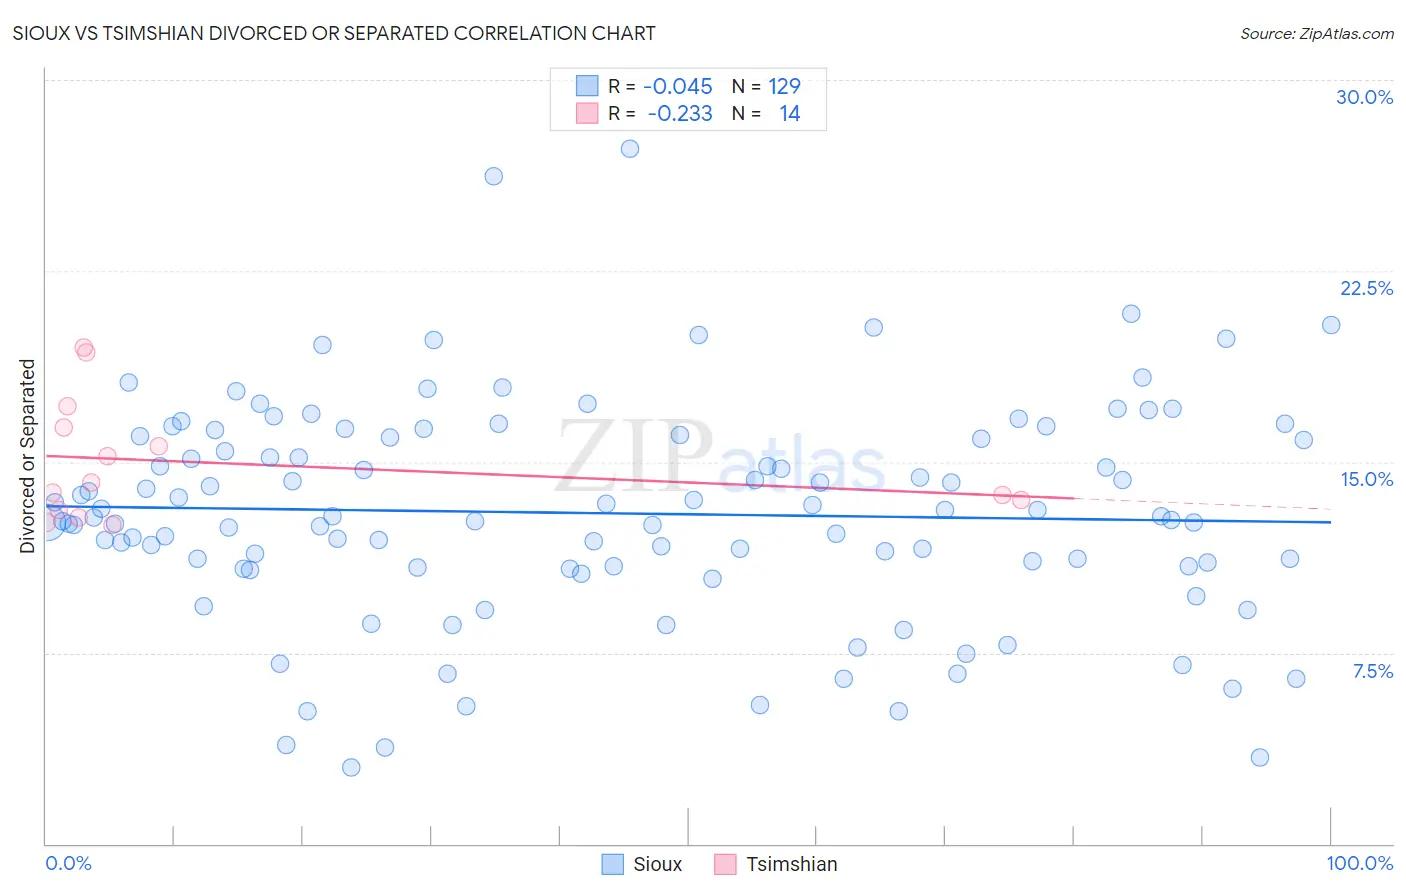
Sioux vs Tsimshian Divorced or Separated Correlation Chart
The statistical analysis conducted on geographies consisting of 234,160,973 people shows no correlation between the proportion of Sioux and percentage of population currently divorced or separated in the United States with a correlation coefficient (R) of -0.045 and weighted average of 13.2%. Similarly, the statistical analysis conducted on geographies consisting of 15,626,183 people shows a weak negative correlation between the proportion of Tsimshian and percentage of population currently divorced or separated in the United States with a correlation coefficient (R) of -0.233 and weighted average of 13.3%, a difference of 0.82%.
Divorced or Separated Correlation Summary
| Measurement | Sioux | Tsimshian |
| Minimum | 3.0% | 12.5% |
| Maximum | 27.3% | 19.5% |
| Range | 24.3% | 7.0% |
| Mean | 13.0% | 15.0% |
| Median | 12.8% | 14.0% |
| Interquartile 25% (IQ1) | 10.9% | 13.1% |
| Interquartile 75% (IQ3) | 16.0% | 16.3% |
| Interquartile Range (IQR) | 5.1% | 3.2% |
| Standard Deviation (Sample) | 4.3% | 2.4% |
| Standard Deviation (Population) | 4.3% | 2.3% |
Demographics Similar to Sioux and Tsimshian by Divorced or Separated
In terms of divorced or separated, the demographic groups most similar to Sioux are African (13.2%, a difference of 0.020%), American (13.2%, a difference of 0.040%), Ottawa (13.2%, a difference of 0.050%), French American Indian (13.2%, a difference of 0.14%), and Blackfeet (13.3%, a difference of 0.35%). Similarly, the demographic groups most similar to Tsimshian are Haitian (13.3%, a difference of 0.020%), Spanish American (13.3%, a difference of 0.030%), Cree (13.4%, a difference of 0.050%), Puget Sound Salish (13.4%, a difference of 0.080%), and Cajun (13.4%, a difference of 0.14%).
| Demographics | Rating | Rank | Divorced or Separated |
| Cape Verdeans | 0.0 /100 | #303 | Tragic 13.1% |
| Hopi | 0.0 /100 | #304 | Tragic 13.2% |
| Chippewa | 0.0 /100 | #305 | Tragic 13.2% |
| Tlingit-Haida | 0.0 /100 | #306 | Tragic 13.2% |
| French American Indians | 0.0 /100 | #307 | Tragic 13.2% |
| Ottawa | 0.0 /100 | #308 | Tragic 13.2% |
| Americans | 0.0 /100 | #309 | Tragic 13.2% |
| Africans | 0.0 /100 | #310 | Tragic 13.2% |
| Sioux | 0.0 /100 | #311 | Tragic 13.2% |
| Blackfeet | 0.0 /100 | #312 | Tragic 13.3% |
| Immigrants | Nicaragua | 0.0 /100 | #313 | Tragic 13.3% |
| Yaqui | 0.0 /100 | #314 | Tragic 13.3% |
| Spanish Americans | 0.0 /100 | #315 | Tragic 13.3% |
| Tsimshian | 0.0 /100 | #316 | Tragic 13.3% |
| Haitians | 0.0 /100 | #317 | Tragic 13.3% |
| Cree | 0.0 /100 | #318 | Tragic 13.4% |
| Puget Sound Salish | 0.0 /100 | #319 | Tragic 13.4% |
| Cajuns | 0.0 /100 | #320 | Tragic 13.4% |
| Cheyenne | 0.0 /100 | #321 | Tragic 13.4% |
| Immigrants | Haiti | 0.0 /100 | #322 | Tragic 13.4% |
| U.S. Virgin Islanders | 0.0 /100 | #323 | Tragic 13.4% |