Ethiopian vs Bolivian Householder Income Ages 25 - 44 years
COMPARE
Ethiopian
Bolivian
Householder Income Ages 25 - 44 years
Householder Income Ages 25 - 44 years Comparison
Ethiopians
Bolivians
$96,824
HOUSEHOLDER INCOME AGES 25 - 44 YEARS
77.8/ 100
METRIC RATING
146th/ 347
METRIC RANK
$109,372
HOUSEHOLDER INCOME AGES 25 - 44 YEARS
100.0/ 100
METRIC RATING
34th/ 347
METRIC RANK
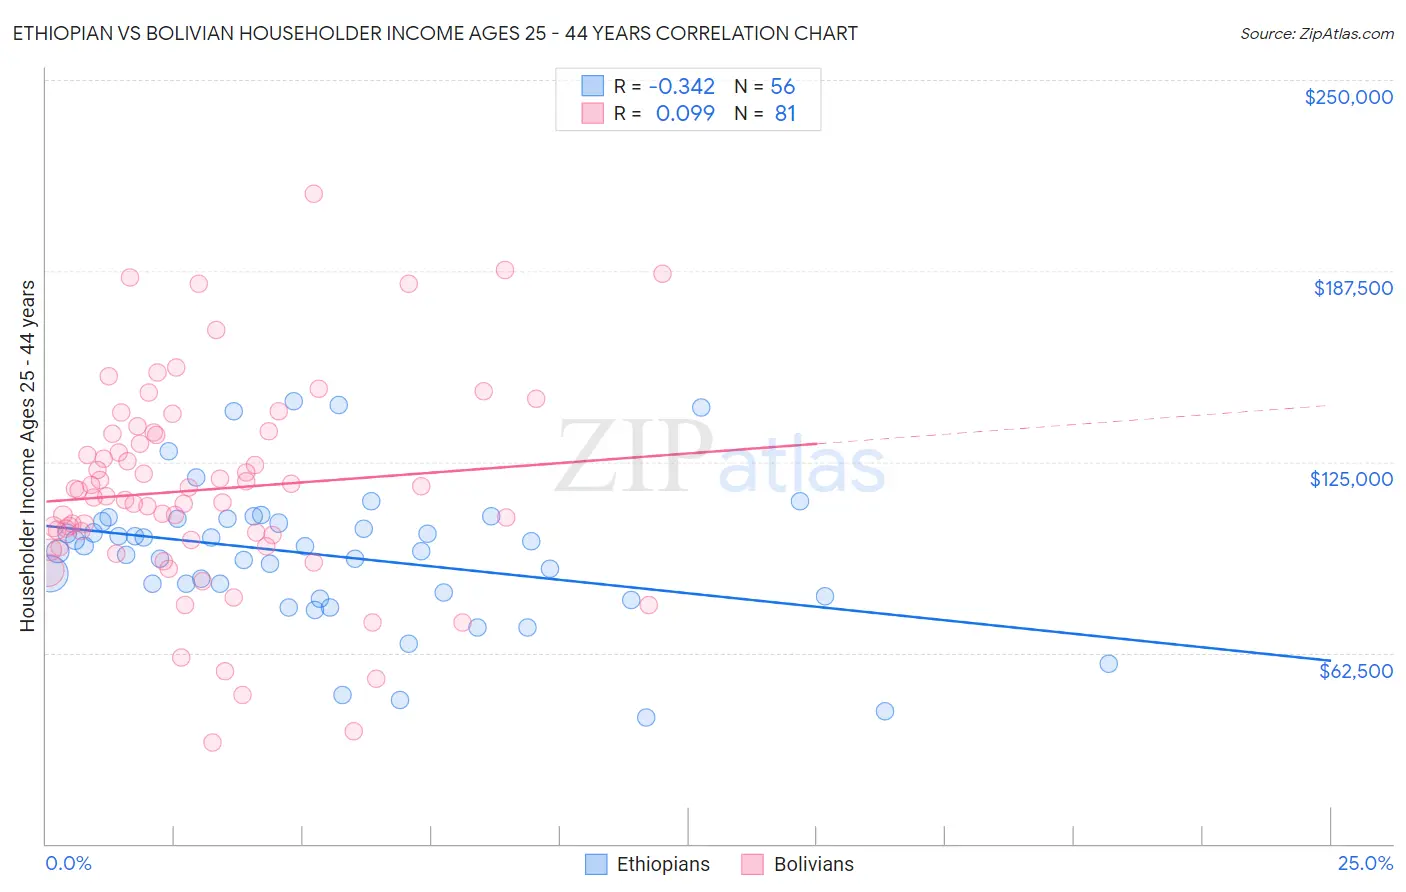
Ethiopian vs Bolivian Householder Income Ages 25 - 44 years Correlation Chart
The statistical analysis conducted on geographies consisting of 222,918,635 people shows a mild negative correlation between the proportion of Ethiopians and household income with householder between the ages 25 and 44 in the United States with a correlation coefficient (R) of -0.342 and weighted average of $96,824. Similarly, the statistical analysis conducted on geographies consisting of 184,532,310 people shows a slight positive correlation between the proportion of Bolivians and household income with householder between the ages 25 and 44 in the United States with a correlation coefficient (R) of 0.099 and weighted average of $109,372, a difference of 13.0%.
Householder Income Ages 25 - 44 years Correlation Summary
| Measurement | Ethiopian | Bolivian |
| Minimum | $41,159 | $33,063 |
| Maximum | $144,957 | $212,696 |
| Range | $103,798 | $179,633 |
| Mean | $94,277 | $115,960 |
| Median | $96,491 | $113,745 |
| Interquartile 25% (IQ1) | $81,678 | $98,450 |
| Interquartile 75% (IQ3) | $105,834 | $134,298 |
| Interquartile Range (IQR) | $24,156 | $35,848 |
| Standard Deviation (Sample) | $22,788 | $33,954 |
| Standard Deviation (Population) | $22,583 | $33,744 |
Similar Demographics by Householder Income Ages 25 - 44 years
Demographics Similar to Ethiopians by Householder Income Ages 25 - 44 years
In terms of householder income ages 25 - 44 years, the demographic groups most similar to Ethiopians are Norwegian ($96,866, a difference of 0.040%), Immigrants from Syria ($96,789, a difference of 0.040%), Irish ($96,730, a difference of 0.10%), Basque ($96,709, a difference of 0.12%), and Ugandan ($96,667, a difference of 0.16%).
| Demographics | Rating | Rank | Householder Income Ages 25 - 44 years |
| Immigrants | Peru | 82.2 /100 | #139 | Excellent $97,329 |
| Immigrants | Morocco | 82.0 /100 | #140 | Excellent $97,305 |
| Luxembourgers | 81.5 /100 | #141 | Excellent $97,237 |
| Danes | 81.3 /100 | #142 | Excellent $97,221 |
| Immigrants | Jordan | 81.0 /100 | #143 | Excellent $97,185 |
| Immigrants | Chile | 80.8 /100 | #144 | Excellent $97,159 |
| Norwegians | 78.2 /100 | #145 | Good $96,866 |
| Ethiopians | 77.8 /100 | #146 | Good $96,824 |
| Immigrants | Syria | 77.4 /100 | #147 | Good $96,789 |
| Irish | 76.9 /100 | #148 | Good $96,730 |
| Basques | 76.6 /100 | #149 | Good $96,709 |
| Ugandans | 76.2 /100 | #150 | Good $96,667 |
| Czechs | 74.8 /100 | #151 | Good $96,525 |
| South American Indians | 74.5 /100 | #152 | Good $96,497 |
| Slovenes | 73.9 /100 | #153 | Good $96,439 |
Demographics Similar to Bolivians by Householder Income Ages 25 - 44 years
In terms of householder income ages 25 - 44 years, the demographic groups most similar to Bolivians are Bhutanese ($109,520, a difference of 0.13%), Immigrants from Switzerland ($109,185, a difference of 0.17%), Immigrants from Sri Lanka ($109,741, a difference of 0.34%), Latvian ($108,926, a difference of 0.41%), and Immigrants from Russia ($108,751, a difference of 0.57%).
| Demographics | Rating | Rank | Householder Income Ages 25 - 44 years |
| Russians | 100.0 /100 | #27 | Exceptional $110,398 |
| Immigrants | Denmark | 100.0 /100 | #28 | Exceptional $110,363 |
| Turks | 100.0 /100 | #29 | Exceptional $110,318 |
| Immigrants | Greece | 100.0 /100 | #30 | Exceptional $110,103 |
| Maltese | 100.0 /100 | #31 | Exceptional $110,064 |
| Immigrants | Sri Lanka | 100.0 /100 | #32 | Exceptional $109,741 |
| Bhutanese | 100.0 /100 | #33 | Exceptional $109,520 |
| Bolivians | 100.0 /100 | #34 | Exceptional $109,372 |
| Immigrants | Switzerland | 100.0 /100 | #35 | Exceptional $109,185 |
| Latvians | 100.0 /100 | #36 | Exceptional $108,926 |
| Immigrants | Russia | 100.0 /100 | #37 | Exceptional $108,751 |
| Soviet Union | 100.0 /100 | #38 | Exceptional $108,457 |
| Immigrants | France | 99.9 /100 | #39 | Exceptional $108,257 |
| Immigrants | Lithuania | 99.9 /100 | #40 | Exceptional $108,149 |
| Immigrants | Bolivia | 99.9 /100 | #41 | Exceptional $108,128 |