Immigrants from Philippines vs Arab Divorced or Separated
COMPARE
Immigrants from Philippines
Arab
Divorced or Separated
Divorced or Separated Comparison
Immigrants from Philippines
Arabs
11.3%
DIVORCED OR SEPARATED
99.9/ 100
METRIC RATING
56th/ 347
METRIC RANK
11.6%
DIVORCED OR SEPARATED
98.9/ 100
METRIC RATING
93rd/ 347
METRIC RANK
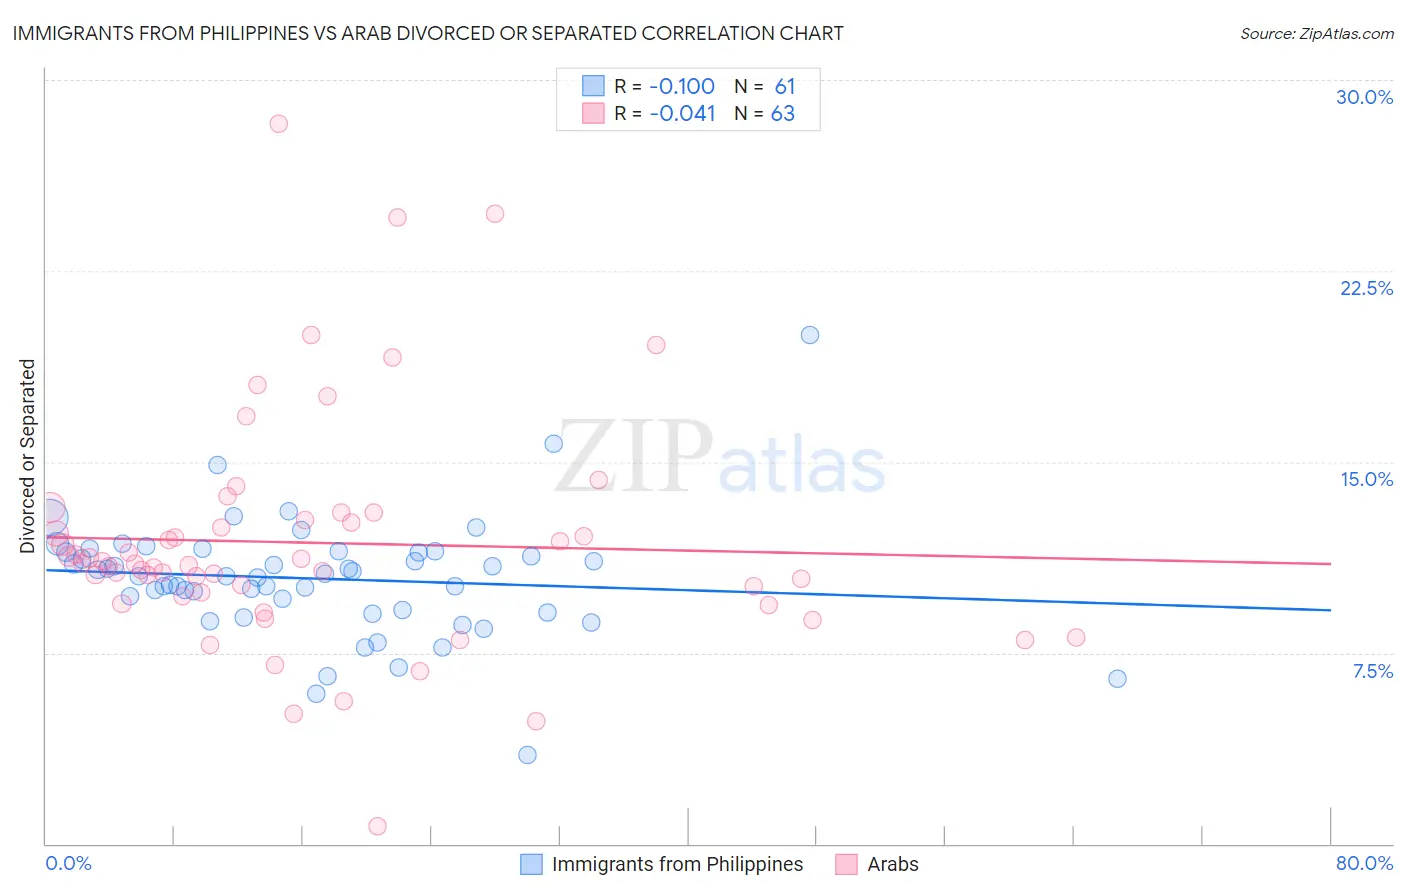
Immigrants from Philippines vs Arab Divorced or Separated Correlation Chart
The statistical analysis conducted on geographies consisting of 471,142,123 people shows a poor negative correlation between the proportion of Immigrants from Philippines and percentage of population currently divorced or separated in the United States with a correlation coefficient (R) of -0.100 and weighted average of 11.3%. Similarly, the statistical analysis conducted on geographies consisting of 486,549,108 people shows no correlation between the proportion of Arabs and percentage of population currently divorced or separated in the United States with a correlation coefficient (R) of -0.041 and weighted average of 11.6%, a difference of 2.4%.
Divorced or Separated Correlation Summary
| Measurement | Immigrants from Philippines | Arab |
| Minimum | 3.5% | 0.70% |
| Maximum | 20.0% | 28.3% |
| Range | 16.5% | 27.6% |
| Mean | 10.4% | 11.8% |
| Median | 10.5% | 11.0% |
| Interquartile 25% (IQ1) | 9.1% | 9.7% |
| Interquartile 75% (IQ3) | 11.5% | 12.7% |
| Interquartile Range (IQR) | 2.3% | 3.0% |
| Standard Deviation (Sample) | 2.4% | 4.6% |
| Standard Deviation (Population) | 2.4% | 4.6% |
Similar Demographics by Divorced or Separated
Demographics Similar to Immigrants from Philippines by Divorced or Separated
In terms of divorced or separated, the demographic groups most similar to Immigrants from Philippines are Immigrants from Vietnam (11.3%, a difference of 0.010%), Eastern European (11.3%, a difference of 0.070%), Immigrants from Yemen (11.3%, a difference of 0.070%), Sri Lankan (11.3%, a difference of 0.070%), and Israeli (11.3%, a difference of 0.17%).
| Demographics | Rating | Rank | Divorced or Separated |
| Immigrants | Saudi Arabia | 100.0 /100 | #49 | Exceptional 11.2% |
| Bolivians | 100.0 /100 | #50 | Exceptional 11.2% |
| Immigrants | Bolivia | 100.0 /100 | #51 | Exceptional 11.3% |
| Immigrants | Australia | 99.9 /100 | #52 | Exceptional 11.3% |
| Immigrants | Lithuania | 99.9 /100 | #53 | Exceptional 11.3% |
| Eastern Europeans | 99.9 /100 | #54 | Exceptional 11.3% |
| Immigrants | Yemen | 99.9 /100 | #55 | Exceptional 11.3% |
| Immigrants | Philippines | 99.9 /100 | #56 | Exceptional 11.3% |
| Immigrants | Vietnam | 99.9 /100 | #57 | Exceptional 11.3% |
| Sri Lankans | 99.9 /100 | #58 | Exceptional 11.3% |
| Israelis | 99.9 /100 | #59 | Exceptional 11.3% |
| Immigrants | Russia | 99.9 /100 | #60 | Exceptional 11.3% |
| Koreans | 99.9 /100 | #61 | Exceptional 11.3% |
| Luxembourgers | 99.9 /100 | #62 | Exceptional 11.3% |
| Immigrants | Kuwait | 99.9 /100 | #63 | Exceptional 11.3% |
Demographics Similar to Arabs by Divorced or Separated
In terms of divorced or separated, the demographic groups most similar to Arabs are Immigrants from Denmark (11.6%, a difference of 0.0%), Immigrants from Fiji (11.6%, a difference of 0.010%), Spanish American Indian (11.6%, a difference of 0.060%), Zimbabwean (11.6%, a difference of 0.10%), and Immigrants from Serbia (11.6%, a difference of 0.11%).
| Demographics | Rating | Rank | Divorced or Separated |
| Immigrants | Latvia | 99.2 /100 | #86 | Exceptional 11.6% |
| Immigrants | Nepal | 99.2 /100 | #87 | Exceptional 11.6% |
| Immigrants | Europe | 99.2 /100 | #88 | Exceptional 11.6% |
| Immigrants | Southern Europe | 99.1 /100 | #89 | Exceptional 11.6% |
| Zimbabweans | 99.0 /100 | #90 | Exceptional 11.6% |
| Spanish American Indians | 99.0 /100 | #91 | Exceptional 11.6% |
| Immigrants | Denmark | 98.9 /100 | #92 | Exceptional 11.6% |
| Arabs | 98.9 /100 | #93 | Exceptional 11.6% |
| Immigrants | Fiji | 98.9 /100 | #94 | Exceptional 11.6% |
| Immigrants | Serbia | 98.8 /100 | #95 | Exceptional 11.6% |
| Immigrants | Ukraine | 98.7 /100 | #96 | Exceptional 11.6% |
| Latvians | 98.7 /100 | #97 | Exceptional 11.6% |
| Immigrants | Jordan | 98.6 /100 | #98 | Exceptional 11.6% |
| Immigrants | Sweden | 98.6 /100 | #99 | Exceptional 11.6% |
| Immigrants | Northern Europe | 98.6 /100 | #100 | Exceptional 11.6% |