Immigrants from Hong Kong vs Arab Divorced or Separated
COMPARE
Immigrants from Hong Kong
Arab
Divorced or Separated
Divorced or Separated Comparison
Immigrants from Hong Kong
Arabs
10.0%
DIVORCED OR SEPARATED
100.0/ 100
METRIC RATING
3rd/ 347
METRIC RANK
11.6%
DIVORCED OR SEPARATED
98.9/ 100
METRIC RATING
93rd/ 347
METRIC RANK
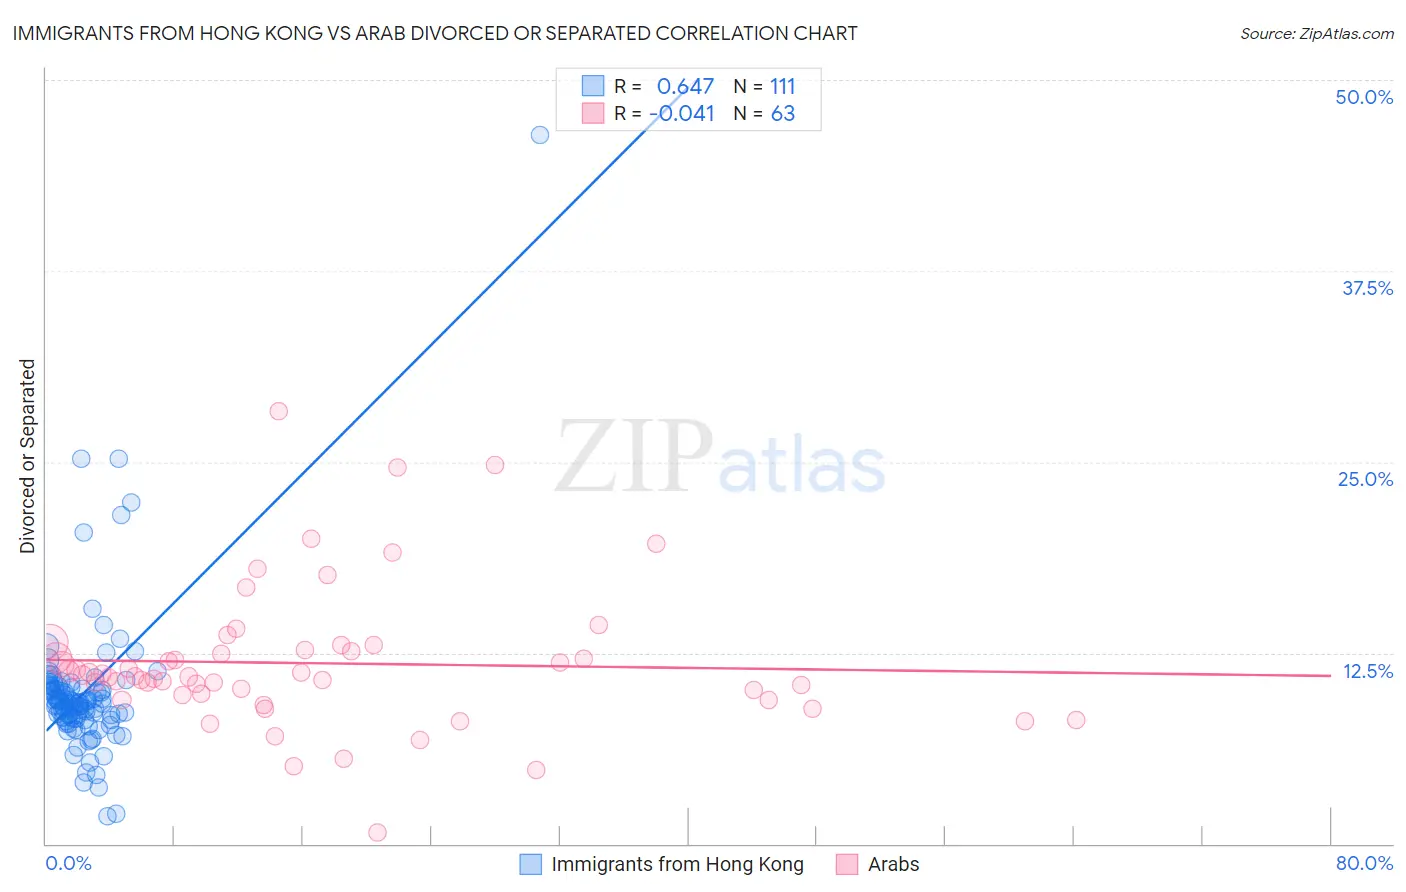
Immigrants from Hong Kong vs Arab Divorced or Separated Correlation Chart
The statistical analysis conducted on geographies consisting of 253,935,113 people shows a significant positive correlation between the proportion of Immigrants from Hong Kong and percentage of population currently divorced or separated in the United States with a correlation coefficient (R) of 0.647 and weighted average of 10.0%. Similarly, the statistical analysis conducted on geographies consisting of 486,549,108 people shows no correlation between the proportion of Arabs and percentage of population currently divorced or separated in the United States with a correlation coefficient (R) of -0.041 and weighted average of 11.6%, a difference of 16.2%.
Divorced or Separated Correlation Summary
| Measurement | Immigrants from Hong Kong | Arab |
| Minimum | 1.8% | 0.70% |
| Maximum | 46.4% | 28.3% |
| Range | 44.6% | 27.6% |
| Mean | 9.9% | 11.8% |
| Median | 9.2% | 11.0% |
| Interquartile 25% (IQ1) | 8.2% | 9.7% |
| Interquartile 75% (IQ3) | 10.2% | 12.7% |
| Interquartile Range (IQR) | 2.0% | 3.0% |
| Standard Deviation (Sample) | 5.0% | 4.6% |
| Standard Deviation (Population) | 5.0% | 4.6% |
Similar Demographics by Divorced or Separated
Demographics Similar to Immigrants from Hong Kong by Divorced or Separated
In terms of divorced or separated, the demographic groups most similar to Immigrants from Hong Kong are Filipino (9.9%, a difference of 0.56%), Immigrants from China (10.0%, a difference of 0.72%), Immigrants from India (10.1%, a difference of 0.96%), Immigrants from Taiwan (9.8%, a difference of 1.6%), and Indian (Asian) (10.2%, a difference of 2.3%).
| Demographics | Rating | Rank | Divorced or Separated |
| Immigrants | Taiwan | 100.0 /100 | #1 | Exceptional 9.8% |
| Filipinos | 100.0 /100 | #2 | Exceptional 9.9% |
| Immigrants | Hong Kong | 100.0 /100 | #3 | Exceptional 10.0% |
| Immigrants | China | 100.0 /100 | #4 | Exceptional 10.0% |
| Immigrants | India | 100.0 /100 | #5 | Exceptional 10.1% |
| Indians (Asian) | 100.0 /100 | #6 | Exceptional 10.2% |
| Thais | 100.0 /100 | #7 | Exceptional 10.2% |
| Immigrants | Eastern Asia | 100.0 /100 | #8 | Exceptional 10.2% |
| Yup'ik | 100.0 /100 | #9 | Exceptional 10.3% |
| Immigrants | Singapore | 100.0 /100 | #10 | Exceptional 10.3% |
| Immigrants | South Central Asia | 100.0 /100 | #11 | Exceptional 10.4% |
| Okinawans | 100.0 /100 | #12 | Exceptional 10.5% |
| Cypriots | 100.0 /100 | #13 | Exceptional 10.5% |
| Assyrians/Chaldeans/Syriacs | 100.0 /100 | #14 | Exceptional 10.6% |
| Immigrants | Armenia | 100.0 /100 | #15 | Exceptional 10.6% |
Demographics Similar to Arabs by Divorced or Separated
In terms of divorced or separated, the demographic groups most similar to Arabs are Immigrants from Denmark (11.6%, a difference of 0.0%), Immigrants from Fiji (11.6%, a difference of 0.010%), Spanish American Indian (11.6%, a difference of 0.060%), Zimbabwean (11.6%, a difference of 0.10%), and Immigrants from Serbia (11.6%, a difference of 0.11%).
| Demographics | Rating | Rank | Divorced or Separated |
| Immigrants | Latvia | 99.2 /100 | #86 | Exceptional 11.6% |
| Immigrants | Nepal | 99.2 /100 | #87 | Exceptional 11.6% |
| Immigrants | Europe | 99.2 /100 | #88 | Exceptional 11.6% |
| Immigrants | Southern Europe | 99.1 /100 | #89 | Exceptional 11.6% |
| Zimbabweans | 99.0 /100 | #90 | Exceptional 11.6% |
| Spanish American Indians | 99.0 /100 | #91 | Exceptional 11.6% |
| Immigrants | Denmark | 98.9 /100 | #92 | Exceptional 11.6% |
| Arabs | 98.9 /100 | #93 | Exceptional 11.6% |
| Immigrants | Fiji | 98.9 /100 | #94 | Exceptional 11.6% |
| Immigrants | Serbia | 98.8 /100 | #95 | Exceptional 11.6% |
| Immigrants | Ukraine | 98.7 /100 | #96 | Exceptional 11.6% |
| Latvians | 98.7 /100 | #97 | Exceptional 11.6% |
| Immigrants | Jordan | 98.6 /100 | #98 | Exceptional 11.6% |
| Immigrants | Sweden | 98.6 /100 | #99 | Exceptional 11.6% |
| Immigrants | Northern Europe | 98.6 /100 | #100 | Exceptional 11.6% |