Immigrants from North Macedonia vs Arab Divorced or Separated
COMPARE
Immigrants from North Macedonia
Arab
Divorced or Separated
Divorced or Separated Comparison
Immigrants from North Macedonia
Arabs
11.5%
DIVORCED OR SEPARATED
99.6/ 100
METRIC RATING
73rd/ 347
METRIC RANK
11.6%
DIVORCED OR SEPARATED
98.9/ 100
METRIC RATING
93rd/ 347
METRIC RANK
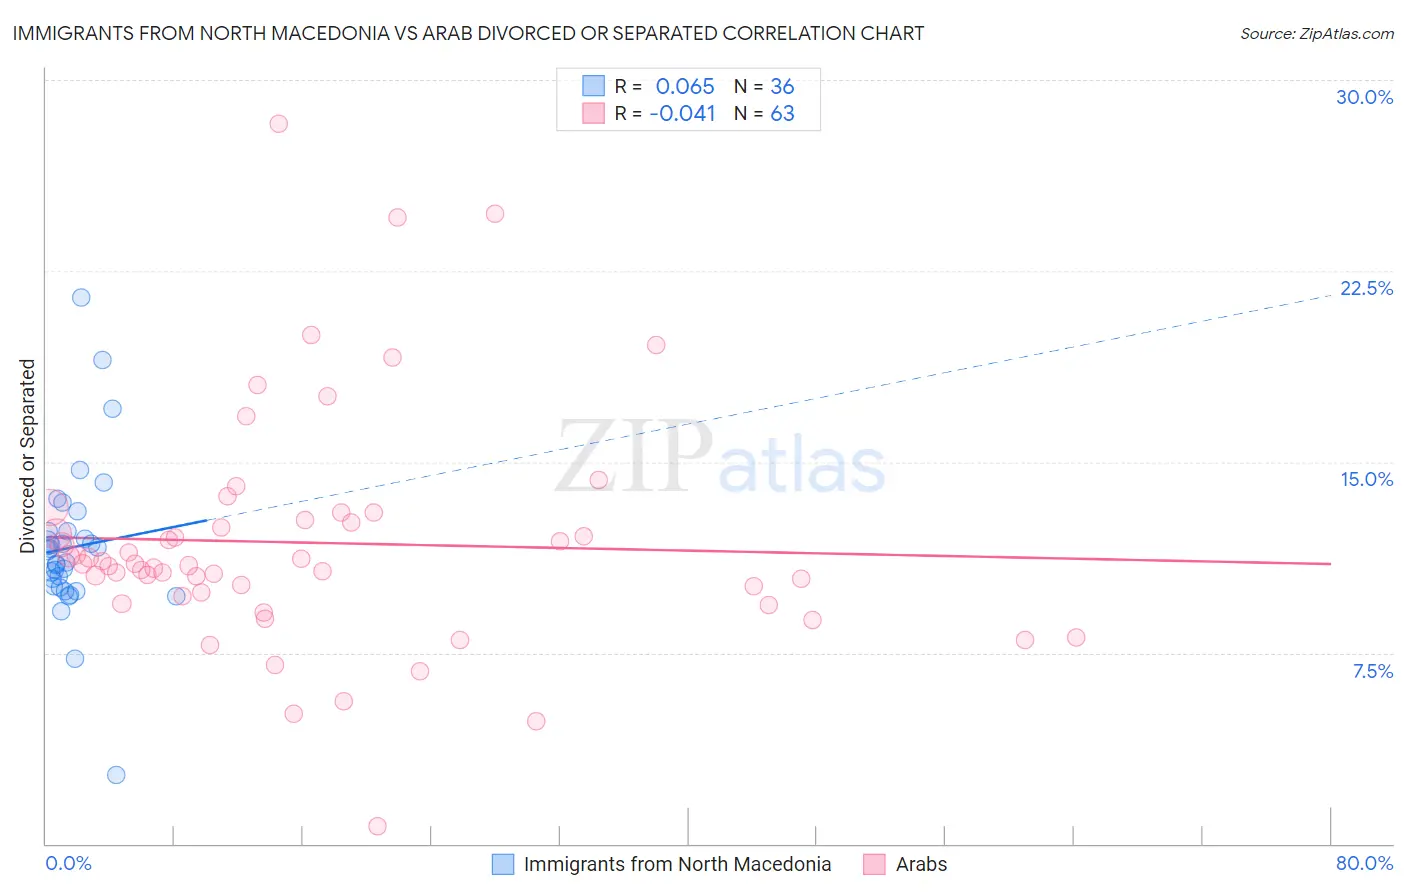
Immigrants from North Macedonia vs Arab Divorced or Separated Correlation Chart
The statistical analysis conducted on geographies consisting of 74,304,783 people shows a slight positive correlation between the proportion of Immigrants from North Macedonia and percentage of population currently divorced or separated in the United States with a correlation coefficient (R) of 0.065 and weighted average of 11.5%. Similarly, the statistical analysis conducted on geographies consisting of 486,549,108 people shows no correlation between the proportion of Arabs and percentage of population currently divorced or separated in the United States with a correlation coefficient (R) of -0.041 and weighted average of 11.6%, a difference of 1.0%.
Divorced or Separated Correlation Summary
| Measurement | Immigrants from North Macedonia | Arab |
| Minimum | 2.7% | 0.70% |
| Maximum | 21.4% | 28.3% |
| Range | 18.7% | 27.6% |
| Mean | 11.6% | 11.8% |
| Median | 11.3% | 11.0% |
| Interquartile 25% (IQ1) | 10.1% | 9.7% |
| Interquartile 75% (IQ3) | 12.3% | 12.7% |
| Interquartile Range (IQR) | 2.2% | 3.0% |
| Standard Deviation (Sample) | 3.1% | 4.6% |
| Standard Deviation (Population) | 3.1% | 4.6% |
Demographics Similar to Immigrants from North Macedonia and Arabs by Divorced or Separated
In terms of divorced or separated, the demographic groups most similar to Immigrants from North Macedonia are Taiwanese (11.5%, a difference of 0.060%), Immigrants from Northern Africa (11.5%, a difference of 0.14%), Albanian (11.5%, a difference of 0.16%), Immigrants from Italy (11.5%, a difference of 0.28%), and Afghan (11.5%, a difference of 0.38%). Similarly, the demographic groups most similar to Arabs are Immigrants from Denmark (11.6%, a difference of 0.0%), Spanish American Indian (11.6%, a difference of 0.060%), Zimbabwean (11.6%, a difference of 0.10%), Immigrants from Southern Europe (11.6%, a difference of 0.20%), and Immigrants from Europe (11.6%, a difference of 0.24%).
| Demographics | Rating | Rank | Divorced or Separated |
| Immigrants | North Macedonia | 99.6 /100 | #73 | Exceptional 11.5% |
| Taiwanese | 99.6 /100 | #74 | Exceptional 11.5% |
| Immigrants | Northern Africa | 99.6 /100 | #75 | Exceptional 11.5% |
| Albanians | 99.6 /100 | #76 | Exceptional 11.5% |
| Immigrants | Italy | 99.5 /100 | #77 | Exceptional 11.5% |
| Afghans | 99.4 /100 | #78 | Exceptional 11.5% |
| Guyanese | 99.4 /100 | #79 | Exceptional 11.5% |
| Immigrants | Switzerland | 99.4 /100 | #80 | Exceptional 11.5% |
| Russians | 99.4 /100 | #81 | Exceptional 11.5% |
| Immigrants | Romania | 99.3 /100 | #82 | Exceptional 11.5% |
| Immigrants | Bulgaria | 99.3 /100 | #83 | Exceptional 11.5% |
| Bulgarians | 99.3 /100 | #84 | Exceptional 11.5% |
| Immigrants | Albania | 99.3 /100 | #85 | Exceptional 11.5% |
| Immigrants | Latvia | 99.2 /100 | #86 | Exceptional 11.6% |
| Immigrants | Nepal | 99.2 /100 | #87 | Exceptional 11.6% |
| Immigrants | Europe | 99.2 /100 | #88 | Exceptional 11.6% |
| Immigrants | Southern Europe | 99.1 /100 | #89 | Exceptional 11.6% |
| Zimbabweans | 99.0 /100 | #90 | Exceptional 11.6% |
| Spanish American Indians | 99.0 /100 | #91 | Exceptional 11.6% |
| Immigrants | Denmark | 98.9 /100 | #92 | Exceptional 11.6% |
| Arabs | 98.9 /100 | #93 | Exceptional 11.6% |