Haitian vs Immigrants from Nepal Family Households
COMPARE
Haitian
Immigrants from Nepal
Family Households
Family Households Comparison
Haitians
Immigrants from Nepal
65.2%
FAMILY HOUSEHOLDS
98.1/ 100
METRIC RATING
100th/ 347
METRIC RANK
62.7%
FAMILY HOUSEHOLDS
0.1/ 100
METRIC RATING
289th/ 347
METRIC RANK
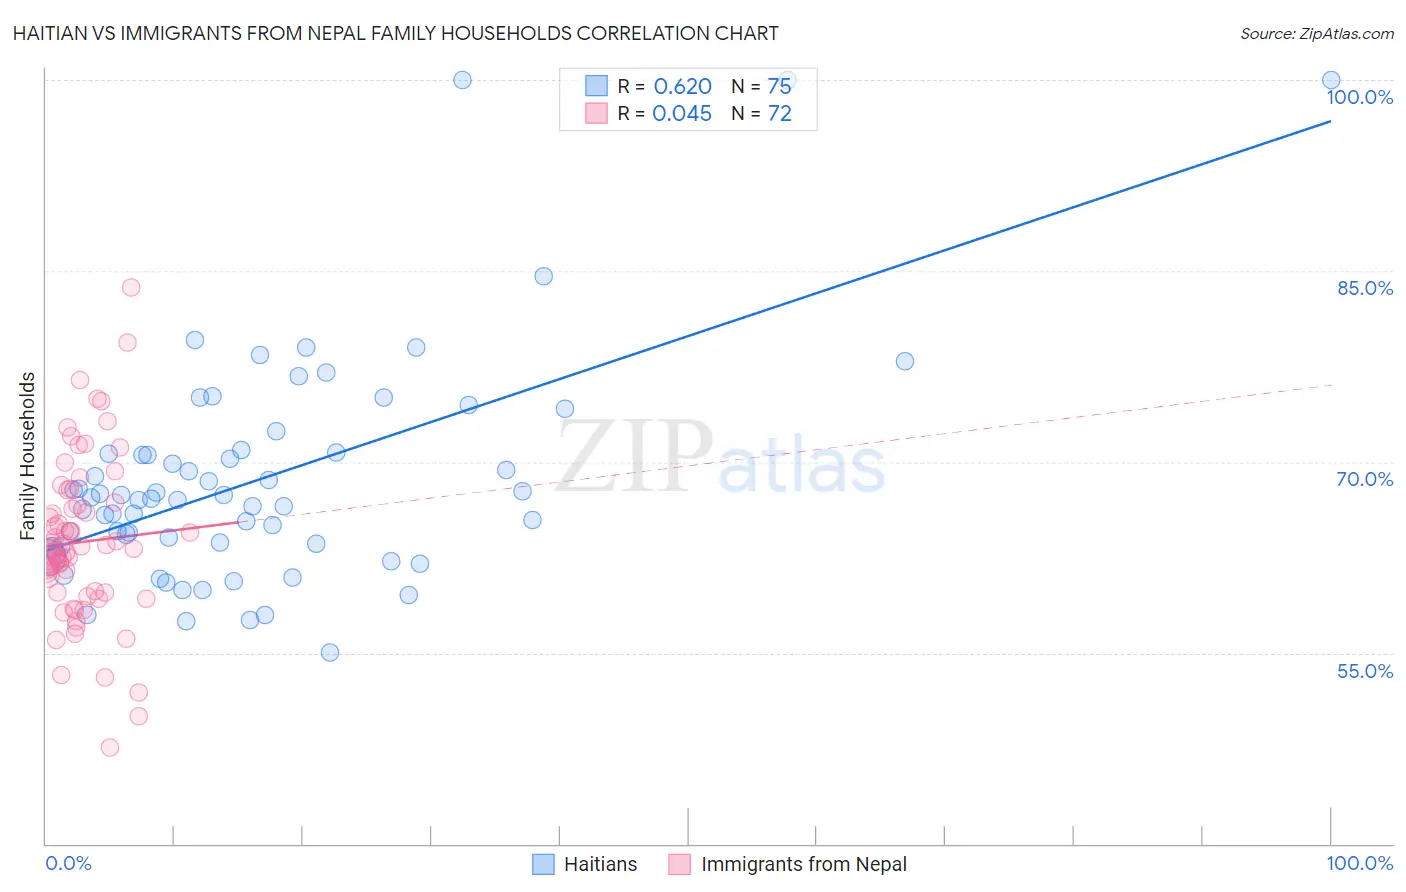
Haitian vs Immigrants from Nepal Family Households Correlation Chart
The statistical analysis conducted on geographies consisting of 287,715,427 people shows a significant positive correlation between the proportion of Haitians and percentage of family households in the United States with a correlation coefficient (R) of 0.620 and weighted average of 65.2%. Similarly, the statistical analysis conducted on geographies consisting of 186,706,837 people shows no correlation between the proportion of Immigrants from Nepal and percentage of family households in the United States with a correlation coefficient (R) of 0.045 and weighted average of 62.7%, a difference of 3.9%.
Family Households Correlation Summary
| Measurement | Haitian | Immigrants from Nepal |
| Minimum | 55.0% | 47.6% |
| Maximum | 100.0% | 83.7% |
| Range | 45.0% | 36.1% |
| Mean | 68.6% | 63.7% |
| Median | 67.1% | 63.3% |
| Interquartile 25% (IQ1) | 63.4% | 59.7% |
| Interquartile 75% (IQ3) | 70.8% | 66.7% |
| Interquartile Range (IQR) | 7.4% | 7.0% |
| Standard Deviation (Sample) | 8.8% | 6.5% |
| Standard Deviation (Population) | 8.7% | 6.4% |
Similar Demographics by Family Households
Demographics Similar to Haitians by Family Households
In terms of family households, the demographic groups most similar to Haitians are Chilean (65.2%, a difference of 0.0%), Immigrants from Sri Lanka (65.1%, a difference of 0.020%), Central American Indian (65.2%, a difference of 0.040%), Indian (Asian) (65.1%, a difference of 0.040%), and Spaniard (65.1%, a difference of 0.040%).
| Demographics | Rating | Rank | Family Households |
| Guyanese | 98.8 /100 | #93 | Exceptional 65.3% |
| Immigrants | Poland | 98.7 /100 | #94 | Exceptional 65.2% |
| Immigrants | Portugal | 98.6 /100 | #95 | Exceptional 65.2% |
| Swiss | 98.6 /100 | #96 | Exceptional 65.2% |
| Guatemalans | 98.6 /100 | #97 | Exceptional 65.2% |
| Immigrants | Syria | 98.4 /100 | #98 | Exceptional 65.2% |
| Central American Indians | 98.3 /100 | #99 | Exceptional 65.2% |
| Haitians | 98.1 /100 | #100 | Exceptional 65.2% |
| Chileans | 98.1 /100 | #101 | Exceptional 65.2% |
| Immigrants | Sri Lanka | 98.0 /100 | #102 | Exceptional 65.1% |
| Indians (Asian) | 97.9 /100 | #103 | Exceptional 65.1% |
| Spaniards | 97.8 /100 | #104 | Exceptional 65.1% |
| English | 97.4 /100 | #105 | Exceptional 65.1% |
| Whites/Caucasians | 97.3 /100 | #106 | Exceptional 65.1% |
| Alaska Natives | 97.3 /100 | #107 | Exceptional 65.1% |
Demographics Similar to Immigrants from Nepal by Family Households
In terms of family households, the demographic groups most similar to Immigrants from Nepal are Immigrants from Grenada (62.6%, a difference of 0.080%), Immigrants from Uganda (62.7%, a difference of 0.090%), British West Indian (62.8%, a difference of 0.11%), Latvian (62.8%, a difference of 0.11%), and U.S. Virgin Islander (62.6%, a difference of 0.13%).
| Demographics | Rating | Rank | Family Households |
| New Zealanders | 0.1 /100 | #282 | Tragic 62.9% |
| Immigrants | Denmark | 0.1 /100 | #283 | Tragic 62.9% |
| Australians | 0.1 /100 | #284 | Tragic 62.8% |
| Mongolians | 0.1 /100 | #285 | Tragic 62.8% |
| British West Indians | 0.1 /100 | #286 | Tragic 62.8% |
| Latvians | 0.1 /100 | #287 | Tragic 62.8% |
| Immigrants | Uganda | 0.1 /100 | #288 | Tragic 62.7% |
| Immigrants | Nepal | 0.1 /100 | #289 | Tragic 62.7% |
| Immigrants | Grenada | 0.0 /100 | #290 | Tragic 62.6% |
| U.S. Virgin Islanders | 0.0 /100 | #291 | Tragic 62.6% |
| Immigrants | Burma/Myanmar | 0.0 /100 | #292 | Tragic 62.6% |
| Immigrants | Sweden | 0.0 /100 | #293 | Tragic 62.5% |
| Barbadians | 0.0 /100 | #294 | Tragic 62.5% |
| Okinawans | 0.0 /100 | #295 | Tragic 62.5% |
| Slovenes | 0.0 /100 | #296 | Tragic 62.4% |