Estonian vs Costa Rican Currently Married
COMPARE
Estonian
Costa Rican
Currently Married
Currently Married Comparison
Estonians
Costa Ricans
48.2%
CURRENTLY MARRIED
97.4/ 100
METRIC RATING
74th/ 347
METRIC RANK
46.5%
CURRENTLY MARRIED
43.7/ 100
METRIC RATING
180th/ 347
METRIC RANK
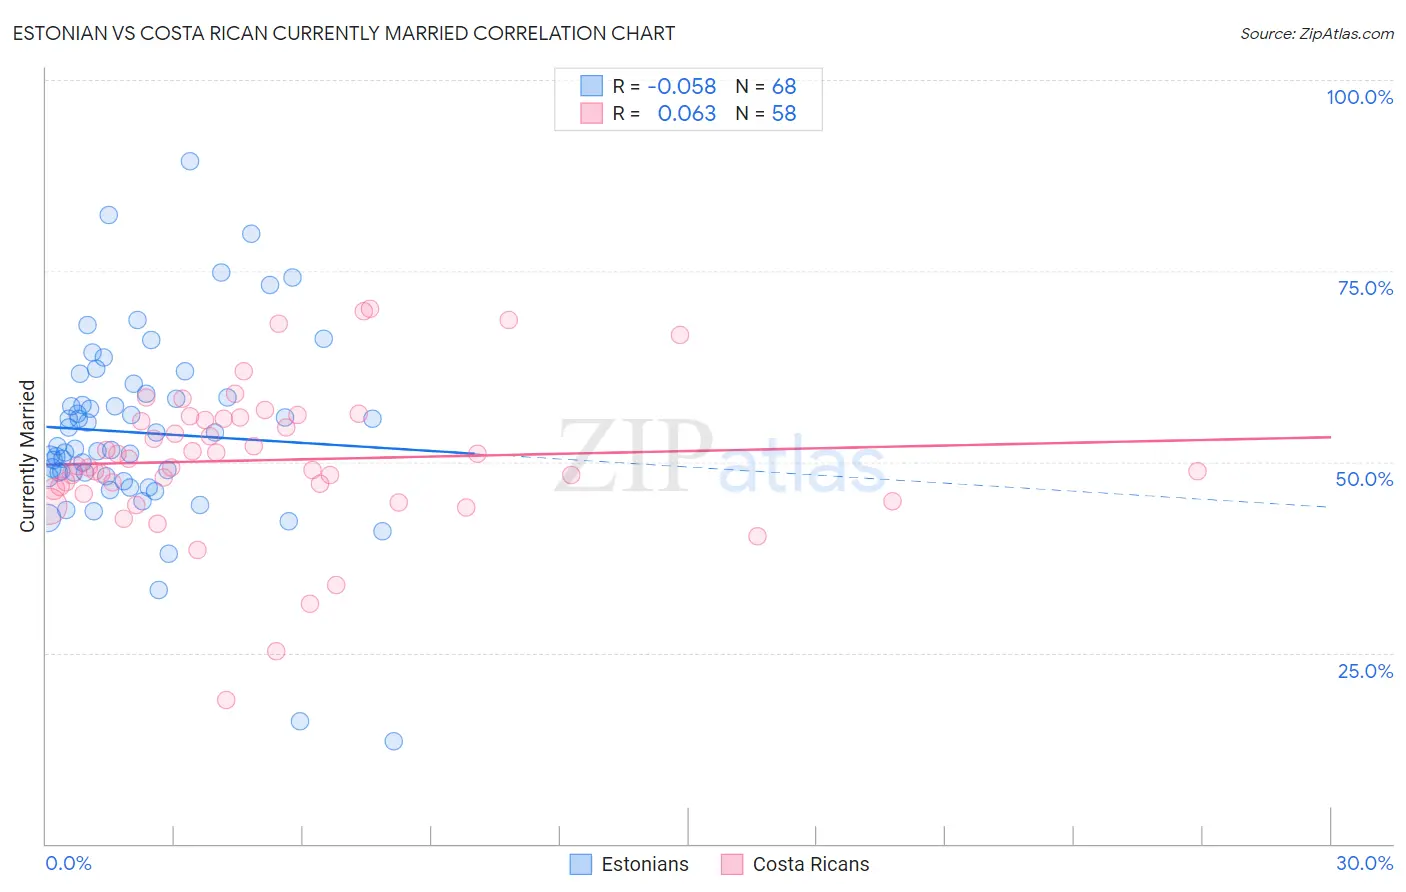
Estonian vs Costa Rican Currently Married Correlation Chart
The statistical analysis conducted on geographies consisting of 123,509,767 people shows a slight negative correlation between the proportion of Estonians and percentage of population currently married in the United States with a correlation coefficient (R) of -0.058 and weighted average of 48.2%. Similarly, the statistical analysis conducted on geographies consisting of 253,590,013 people shows a slight positive correlation between the proportion of Costa Ricans and percentage of population currently married in the United States with a correlation coefficient (R) of 0.063 and weighted average of 46.5%, a difference of 3.6%.
Currently Married Correlation Summary
| Measurement | Estonian | Costa Rican |
| Minimum | 13.5% | 18.8% |
| Maximum | 89.3% | 70.1% |
| Range | 75.8% | 51.3% |
| Mean | 53.8% | 50.2% |
| Median | 51.9% | 49.4% |
| Interquartile 25% (IQ1) | 48.1% | 46.5% |
| Interquartile 75% (IQ3) | 58.7% | 55.6% |
| Interquartile Range (IQR) | 10.6% | 9.1% |
| Standard Deviation (Sample) | 12.4% | 9.6% |
| Standard Deviation (Population) | 12.3% | 9.5% |
Similar Demographics by Currently Married
Demographics Similar to Estonians by Currently Married
In terms of currently married, the demographic groups most similar to Estonians are Immigrants from Eastern Asia (48.2%, a difference of 0.030%), Immigrants from Lebanon (48.2%, a difference of 0.050%), Immigrants from Belarus (48.1%, a difference of 0.070%), Basque (48.1%, a difference of 0.090%), and Slovene (48.1%, a difference of 0.11%).
| Demographics | Rating | Rank | Currently Married |
| Slovaks | 98.2 /100 | #67 | Exceptional 48.3% |
| Immigrants | England | 98.2 /100 | #68 | Exceptional 48.3% |
| Canadians | 98.1 /100 | #69 | Exceptional 48.3% |
| Immigrants | Asia | 97.9 /100 | #70 | Exceptional 48.3% |
| Macedonians | 97.9 /100 | #71 | Exceptional 48.3% |
| Immigrants | Lebanon | 97.6 /100 | #72 | Exceptional 48.2% |
| Immigrants | Eastern Asia | 97.5 /100 | #73 | Exceptional 48.2% |
| Estonians | 97.4 /100 | #74 | Exceptional 48.2% |
| Immigrants | Belarus | 97.2 /100 | #75 | Exceptional 48.1% |
| Basques | 97.2 /100 | #76 | Exceptional 48.1% |
| Slovenes | 97.1 /100 | #77 | Exceptional 48.1% |
| Immigrants | Belgium | 97.1 /100 | #78 | Exceptional 48.1% |
| Immigrants | South Africa | 97.0 /100 | #79 | Exceptional 48.1% |
| Immigrants | Poland | 96.9 /100 | #80 | Exceptional 48.1% |
| Immigrants | Sri Lanka | 96.9 /100 | #81 | Exceptional 48.1% |
Demographics Similar to Costa Ricans by Currently Married
In terms of currently married, the demographic groups most similar to Costa Ricans are Ottawa (46.5%, a difference of 0.020%), Immigrants from Oceania (46.5%, a difference of 0.030%), Potawatomi (46.5%, a difference of 0.070%), Chickasaw (46.6%, a difference of 0.15%), and Immigrants from Northern Africa (46.5%, a difference of 0.15%).
| Demographics | Rating | Rank | Currently Married |
| Tlingit-Haida | 51.2 /100 | #173 | Average 46.7% |
| Peruvians | 50.0 /100 | #174 | Average 46.6% |
| Immigrants | Brazil | 49.9 /100 | #175 | Average 46.6% |
| Hawaiians | 48.6 /100 | #176 | Average 46.6% |
| Israelis | 48.6 /100 | #177 | Average 46.6% |
| Chickasaw | 47.8 /100 | #178 | Average 46.6% |
| Immigrants | Oceania | 44.6 /100 | #179 | Average 46.5% |
| Costa Ricans | 43.7 /100 | #180 | Average 46.5% |
| Ottawa | 43.0 /100 | #181 | Average 46.5% |
| Potawatomi | 41.9 /100 | #182 | Average 46.5% |
| Immigrants | Northern Africa | 39.7 /100 | #183 | Fair 46.5% |
| Brazilians | 39.3 /100 | #184 | Fair 46.4% |
| Mongolians | 37.6 /100 | #185 | Fair 46.4% |
| Immigrants | Chile | 36.8 /100 | #186 | Fair 46.4% |
| Immigrants | Peru | 35.3 /100 | #187 | Fair 46.4% |