Estonian vs Costa Rican Single Father Households
COMPARE
Estonian
Costa Rican
Single Father Households
Single Father Households Comparison
Estonians
Costa Ricans
2.1%
SINGLE FATHER HOUSEHOLDS
99.7/ 100
METRIC RATING
78th/ 347
METRIC RANK
2.3%
SINGLE FATHER HOUSEHOLDS
44.1/ 100
METRIC RATING
178th/ 347
METRIC RANK
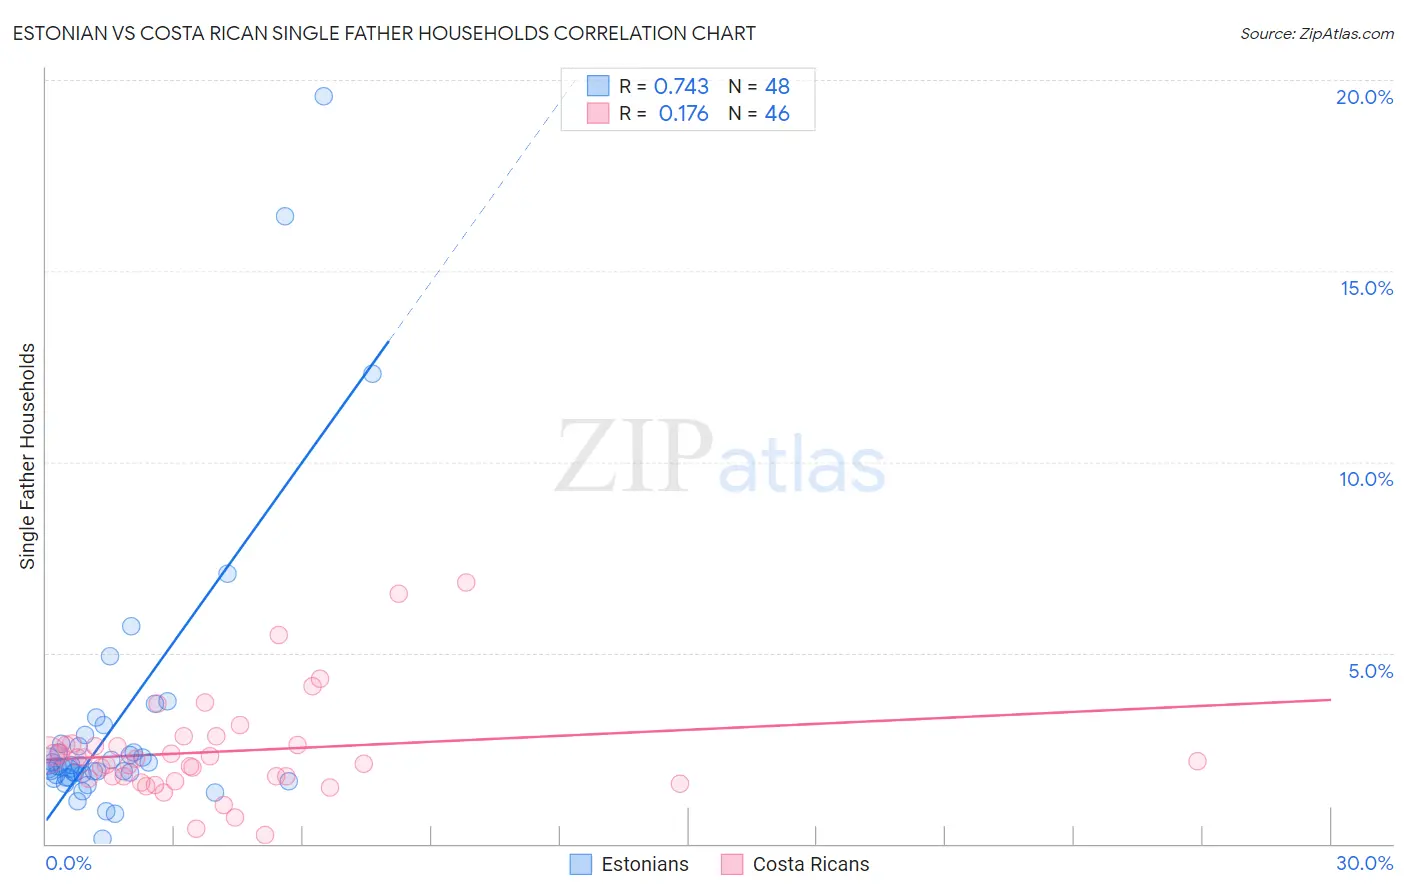
Estonian vs Costa Rican Single Father Households Correlation Chart
The statistical analysis conducted on geographies consisting of 123,065,759 people shows a strong positive correlation between the proportion of Estonians and percentage of single father households in the United States with a correlation coefficient (R) of 0.743 and weighted average of 2.1%. Similarly, the statistical analysis conducted on geographies consisting of 252,556,792 people shows a poor positive correlation between the proportion of Costa Ricans and percentage of single father households in the United States with a correlation coefficient (R) of 0.176 and weighted average of 2.3%, a difference of 12.7%.
Single Father Households Correlation Summary
| Measurement | Estonian | Costa Rican |
| Minimum | 0.12% | 0.25% |
| Maximum | 19.6% | 6.9% |
| Range | 19.5% | 6.6% |
| Mean | 3.1% | 2.4% |
| Median | 2.0% | 2.2% |
| Interquartile 25% (IQ1) | 1.8% | 1.7% |
| Interquartile 75% (IQ3) | 2.6% | 2.6% |
| Interquartile Range (IQR) | 0.82% | 0.87% |
| Standard Deviation (Sample) | 3.7% | 1.3% |
| Standard Deviation (Population) | 3.6% | 1.3% |
Similar Demographics by Single Father Households
Demographics Similar to Estonians by Single Father Households
In terms of single father households, the demographic groups most similar to Estonians are Immigrants from Asia (2.1%, a difference of 0.11%), Immigrants from South Africa (2.1%, a difference of 0.20%), Armenian (2.1%, a difference of 0.28%), Immigrants from Saudi Arabia (2.1%, a difference of 0.31%), and New Zealander (2.1%, a difference of 0.33%).
| Demographics | Rating | Rank | Single Father Households |
| Immigrants | Kuwait | 99.8 /100 | #71 | Exceptional 2.1% |
| Immigrants | Spain | 99.8 /100 | #72 | Exceptional 2.1% |
| Immigrants | Bangladesh | 99.8 /100 | #73 | Exceptional 2.1% |
| Immigrants | Egypt | 99.8 /100 | #74 | Exceptional 2.1% |
| Immigrants | Sweden | 99.8 /100 | #75 | Exceptional 2.1% |
| Immigrants | Scotland | 99.8 /100 | #76 | Exceptional 2.1% |
| Immigrants | Saudi Arabia | 99.8 /100 | #77 | Exceptional 2.1% |
| Estonians | 99.7 /100 | #78 | Exceptional 2.1% |
| Immigrants | Asia | 99.7 /100 | #79 | Exceptional 2.1% |
| Immigrants | South Africa | 99.7 /100 | #80 | Exceptional 2.1% |
| Armenians | 99.7 /100 | #81 | Exceptional 2.1% |
| New Zealanders | 99.7 /100 | #82 | Exceptional 2.1% |
| Greeks | 99.7 /100 | #83 | Exceptional 2.1% |
| Carpatho Rusyns | 99.6 /100 | #84 | Exceptional 2.1% |
| Immigrants | Hungary | 99.6 /100 | #85 | Exceptional 2.1% |
Demographics Similar to Costa Ricans by Single Father Households
In terms of single father households, the demographic groups most similar to Costa Ricans are Welsh (2.3%, a difference of 0.0%), Yugoslavian (2.3%, a difference of 0.020%), Jamaican (2.3%, a difference of 0.040%), Belgian (2.3%, a difference of 0.060%), and Immigrants from Panama (2.4%, a difference of 0.17%).
| Demographics | Rating | Rank | Single Father Households |
| Swedes | 61.6 /100 | #171 | Good 2.3% |
| Czechoslovakians | 58.9 /100 | #172 | Average 2.3% |
| Celtics | 55.4 /100 | #173 | Average 2.3% |
| Afghans | 50.0 /100 | #174 | Average 2.3% |
| Immigrants | Jamaica | 49.1 /100 | #175 | Average 2.3% |
| Danes | 48.2 /100 | #176 | Average 2.3% |
| Colombians | 48.0 /100 | #177 | Average 2.3% |
| Costa Ricans | 44.1 /100 | #178 | Average 2.3% |
| Welsh | 44.0 /100 | #179 | Average 2.3% |
| Yugoslavians | 43.9 /100 | #180 | Average 2.3% |
| Jamaicans | 43.5 /100 | #181 | Average 2.3% |
| Belgians | 43.3 /100 | #182 | Average 2.3% |
| Immigrants | Panama | 41.8 /100 | #183 | Average 2.4% |
| Sri Lankans | 41.8 /100 | #184 | Average 2.4% |
| Nigerians | 41.0 /100 | #185 | Average 2.4% |