Mexican vs Costa Rican Currently Married
COMPARE
Mexican
Costa Rican
Currently Married
Currently Married Comparison
Mexicans
Costa Ricans
45.2%
CURRENTLY MARRIED
3.0/ 100
METRIC RATING
221st/ 347
METRIC RANK
46.5%
CURRENTLY MARRIED
43.7/ 100
METRIC RATING
180th/ 347
METRIC RANK
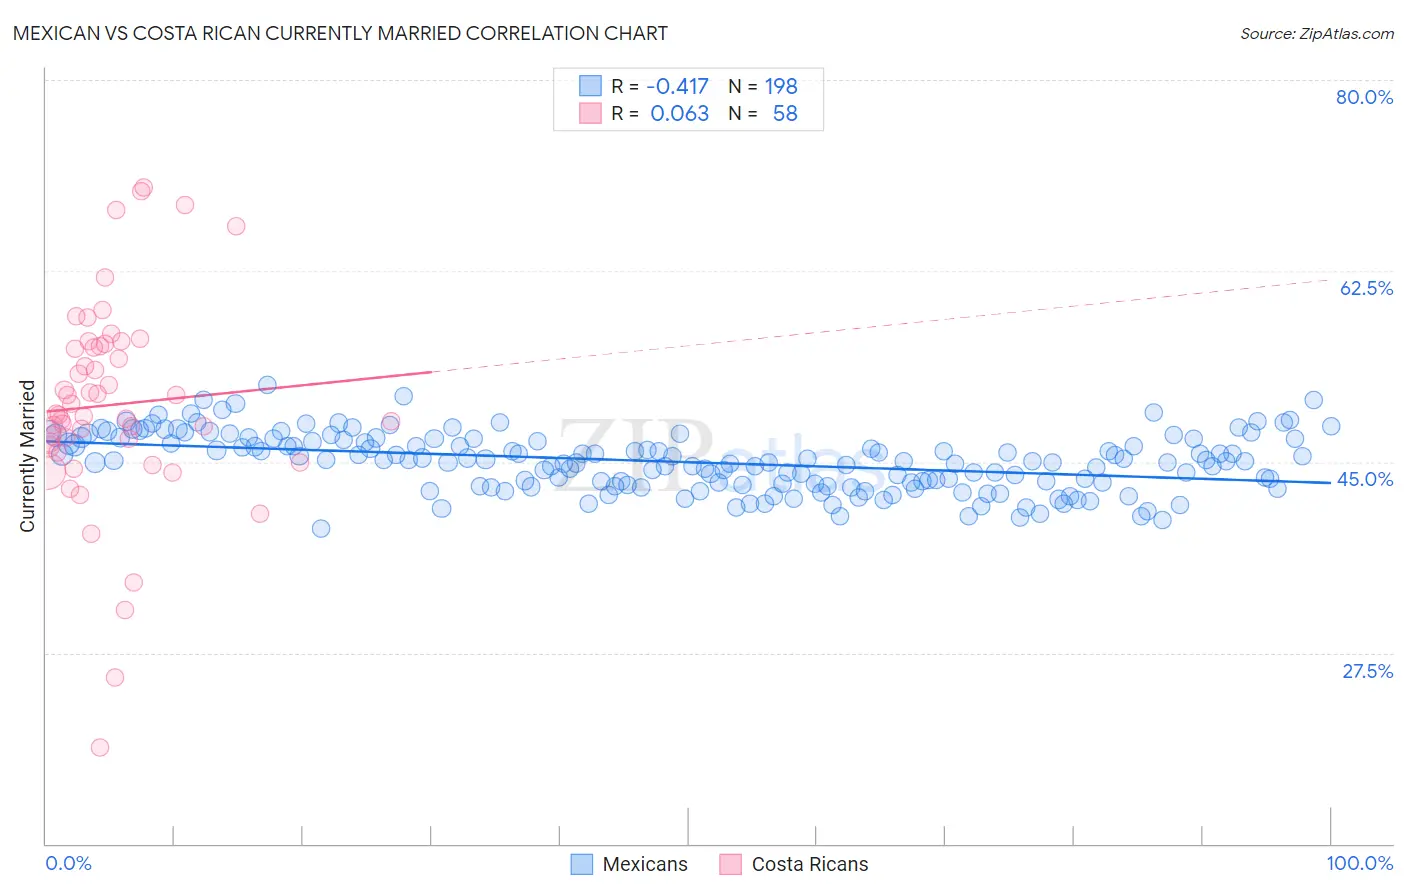
Mexican vs Costa Rican Currently Married Correlation Chart
The statistical analysis conducted on geographies consisting of 565,159,836 people shows a moderate negative correlation between the proportion of Mexicans and percentage of population currently married in the United States with a correlation coefficient (R) of -0.417 and weighted average of 45.2%. Similarly, the statistical analysis conducted on geographies consisting of 253,590,013 people shows a slight positive correlation between the proportion of Costa Ricans and percentage of population currently married in the United States with a correlation coefficient (R) of 0.063 and weighted average of 46.5%, a difference of 3.0%.
Currently Married Correlation Summary
| Measurement | Mexican | Costa Rican |
| Minimum | 38.9% | 18.8% |
| Maximum | 52.1% | 70.1% |
| Range | 13.2% | 51.3% |
| Mean | 45.0% | 50.2% |
| Median | 45.1% | 49.4% |
| Interquartile 25% (IQ1) | 43.0% | 46.5% |
| Interquartile 75% (IQ3) | 47.1% | 55.6% |
| Interquartile Range (IQR) | 4.1% | 9.1% |
| Standard Deviation (Sample) | 2.6% | 9.6% |
| Standard Deviation (Population) | 2.6% | 9.5% |
Similar Demographics by Currently Married
Demographics Similar to Mexicans by Currently Married
In terms of currently married, the demographic groups most similar to Mexicans are Kenyan (45.2%, a difference of 0.020%), Immigrants from Portugal (45.2%, a difference of 0.14%), Immigrants from the Azores (45.1%, a difference of 0.20%), Panamanian (45.3%, a difference of 0.26%), and Immigrants from Laos (45.0%, a difference of 0.28%).
| Demographics | Rating | Rank | Currently Married |
| Dutch West Indians | 6.7 /100 | #214 | Tragic 45.5% |
| German Russians | 6.7 /100 | #215 | Tragic 45.5% |
| Immigrants | Morocco | 5.5 /100 | #216 | Tragic 45.4% |
| Immigrants | Thailand | 5.1 /100 | #217 | Tragic 45.4% |
| Panamanians | 4.0 /100 | #218 | Tragic 45.3% |
| Immigrants | Portugal | 3.5 /100 | #219 | Tragic 45.2% |
| Kenyans | 3.1 /100 | #220 | Tragic 45.2% |
| Mexicans | 3.0 /100 | #221 | Tragic 45.2% |
| Immigrants | Azores | 2.5 /100 | #222 | Tragic 45.1% |
| Immigrants | Laos | 2.3 /100 | #223 | Tragic 45.0% |
| Immigrants | Uganda | 2.2 /100 | #224 | Tragic 45.0% |
| French American Indians | 2.2 /100 | #225 | Tragic 45.0% |
| Comanche | 2.1 /100 | #226 | Tragic 45.0% |
| Spanish Americans | 2.1 /100 | #227 | Tragic 45.0% |
| Immigrants | Uruguay | 2.0 /100 | #228 | Tragic 45.0% |
Demographics Similar to Costa Ricans by Currently Married
In terms of currently married, the demographic groups most similar to Costa Ricans are Ottawa (46.5%, a difference of 0.020%), Immigrants from Oceania (46.5%, a difference of 0.030%), Potawatomi (46.5%, a difference of 0.070%), Chickasaw (46.6%, a difference of 0.15%), and Immigrants from Northern Africa (46.5%, a difference of 0.15%).
| Demographics | Rating | Rank | Currently Married |
| Tlingit-Haida | 51.2 /100 | #173 | Average 46.7% |
| Peruvians | 50.0 /100 | #174 | Average 46.6% |
| Immigrants | Brazil | 49.9 /100 | #175 | Average 46.6% |
| Hawaiians | 48.6 /100 | #176 | Average 46.6% |
| Israelis | 48.6 /100 | #177 | Average 46.6% |
| Chickasaw | 47.8 /100 | #178 | Average 46.6% |
| Immigrants | Oceania | 44.6 /100 | #179 | Average 46.5% |
| Costa Ricans | 43.7 /100 | #180 | Average 46.5% |
| Ottawa | 43.0 /100 | #181 | Average 46.5% |
| Potawatomi | 41.9 /100 | #182 | Average 46.5% |
| Immigrants | Northern Africa | 39.7 /100 | #183 | Fair 46.5% |
| Brazilians | 39.3 /100 | #184 | Fair 46.4% |
| Mongolians | 37.6 /100 | #185 | Fair 46.4% |
| Immigrants | Chile | 36.8 /100 | #186 | Fair 46.4% |
| Immigrants | Peru | 35.3 /100 | #187 | Fair 46.4% |