Estonian vs Immigrants from France Currently Married
COMPARE
Estonian
Immigrants from France
Currently Married
Currently Married Comparison
Estonians
Immigrants from France
48.2%
CURRENTLY MARRIED
97.4/ 100
METRIC RATING
74th/ 347
METRIC RANK
46.2%
CURRENTLY MARRIED
27.7/ 100
METRIC RATING
191st/ 347
METRIC RANK
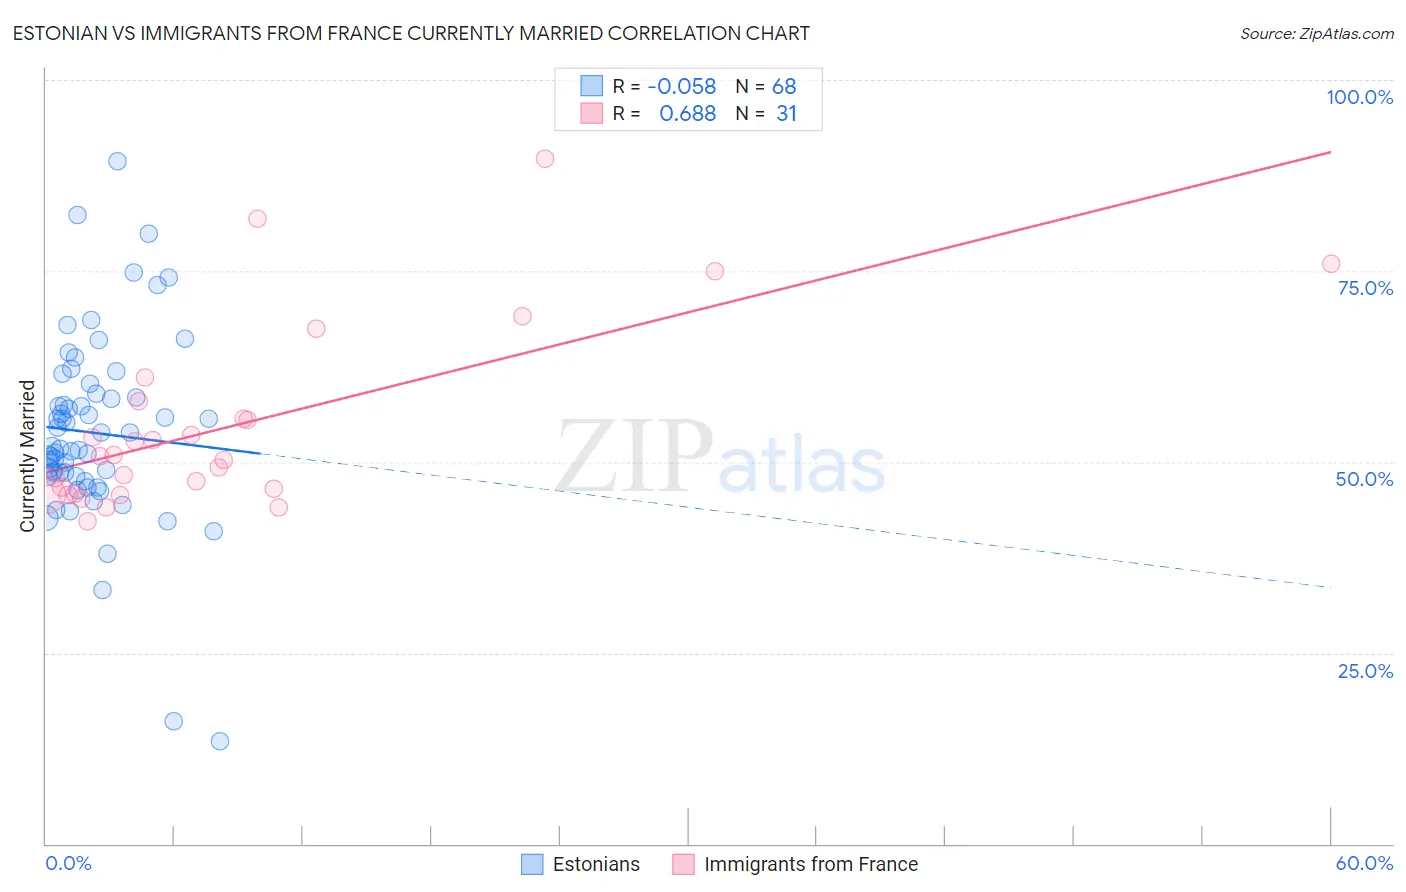
Estonian vs Immigrants from France Currently Married Correlation Chart
The statistical analysis conducted on geographies consisting of 123,509,767 people shows a slight negative correlation between the proportion of Estonians and percentage of population currently married in the United States with a correlation coefficient (R) of -0.058 and weighted average of 48.2%. Similarly, the statistical analysis conducted on geographies consisting of 287,900,584 people shows a significant positive correlation between the proportion of Immigrants from France and percentage of population currently married in the United States with a correlation coefficient (R) of 0.688 and weighted average of 46.2%, a difference of 4.2%.
Currently Married Correlation Summary
| Measurement | Estonian | Immigrants from France |
| Minimum | 13.5% | 42.2% |
| Maximum | 89.3% | 89.7% |
| Range | 75.8% | 47.5% |
| Mean | 53.8% | 54.8% |
| Median | 51.9% | 50.8% |
| Interquartile 25% (IQ1) | 48.1% | 45.8% |
| Interquartile 75% (IQ3) | 58.7% | 57.9% |
| Interquartile Range (IQR) | 10.6% | 12.1% |
| Standard Deviation (Sample) | 12.4% | 12.1% |
| Standard Deviation (Population) | 12.3% | 11.9% |
Similar Demographics by Currently Married
Demographics Similar to Estonians by Currently Married
In terms of currently married, the demographic groups most similar to Estonians are Immigrants from Eastern Asia (48.2%, a difference of 0.030%), Immigrants from Lebanon (48.2%, a difference of 0.050%), Immigrants from Belarus (48.1%, a difference of 0.070%), Basque (48.1%, a difference of 0.090%), and Slovene (48.1%, a difference of 0.11%).
| Demographics | Rating | Rank | Currently Married |
| Slovaks | 98.2 /100 | #67 | Exceptional 48.3% |
| Immigrants | England | 98.2 /100 | #68 | Exceptional 48.3% |
| Canadians | 98.1 /100 | #69 | Exceptional 48.3% |
| Immigrants | Asia | 97.9 /100 | #70 | Exceptional 48.3% |
| Macedonians | 97.9 /100 | #71 | Exceptional 48.3% |
| Immigrants | Lebanon | 97.6 /100 | #72 | Exceptional 48.2% |
| Immigrants | Eastern Asia | 97.5 /100 | #73 | Exceptional 48.2% |
| Estonians | 97.4 /100 | #74 | Exceptional 48.2% |
| Immigrants | Belarus | 97.2 /100 | #75 | Exceptional 48.1% |
| Basques | 97.2 /100 | #76 | Exceptional 48.1% |
| Slovenes | 97.1 /100 | #77 | Exceptional 48.1% |
| Immigrants | Belgium | 97.1 /100 | #78 | Exceptional 48.1% |
| Immigrants | South Africa | 97.0 /100 | #79 | Exceptional 48.1% |
| Immigrants | Poland | 96.9 /100 | #80 | Exceptional 48.1% |
| Immigrants | Sri Lanka | 96.9 /100 | #81 | Exceptional 48.1% |
Demographics Similar to Immigrants from France by Currently Married
In terms of currently married, the demographic groups most similar to Immigrants from France are Choctaw (46.3%, a difference of 0.060%), Soviet Union (46.2%, a difference of 0.090%), Fijian (46.3%, a difference of 0.12%), Immigrants from Fiji (46.2%, a difference of 0.13%), and Colombian (46.3%, a difference of 0.18%).
| Demographics | Rating | Rank | Currently Married |
| Brazilians | 39.3 /100 | #184 | Fair 46.4% |
| Mongolians | 37.6 /100 | #185 | Fair 46.4% |
| Immigrants | Chile | 36.8 /100 | #186 | Fair 46.4% |
| Immigrants | Peru | 35.3 /100 | #187 | Fair 46.4% |
| Colombians | 31.8 /100 | #188 | Fair 46.3% |
| Fijians | 30.3 /100 | #189 | Fair 46.3% |
| Choctaw | 29.1 /100 | #190 | Fair 46.3% |
| Immigrants | France | 27.7 /100 | #191 | Fair 46.2% |
| Soviet Union | 25.7 /100 | #192 | Fair 46.2% |
| Immigrants | Fiji | 25.0 /100 | #193 | Fair 46.2% |
| South Americans | 23.8 /100 | #194 | Fair 46.1% |
| Immigrants | Nepal | 23.7 /100 | #195 | Fair 46.1% |
| Immigrants | Bosnia and Herzegovina | 22.2 /100 | #196 | Fair 46.1% |
| Immigrants | Kuwait | 21.7 /100 | #197 | Fair 46.1% |
| Immigrants | Colombia | 21.0 /100 | #198 | Fair 46.1% |