Estonian vs Immigrants from Albania Currently Married
COMPARE
Estonian
Immigrants from Albania
Currently Married
Currently Married Comparison
Estonians
Immigrants from Albania
48.2%
CURRENTLY MARRIED
97.4/ 100
METRIC RATING
74th/ 347
METRIC RANK
45.9%
CURRENTLY MARRIED
14.5/ 100
METRIC RATING
202nd/ 347
METRIC RANK
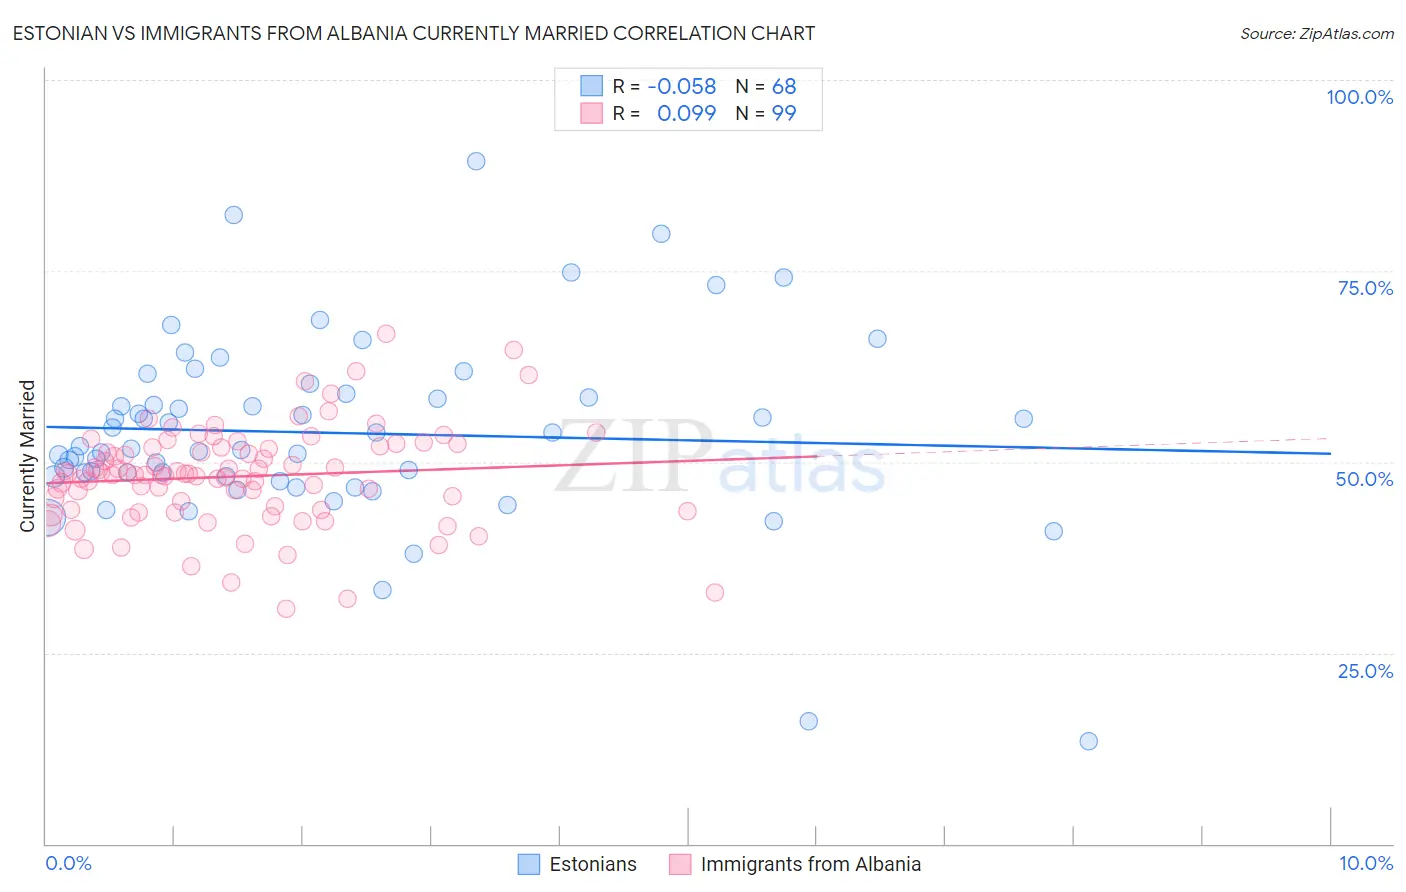
Estonian vs Immigrants from Albania Currently Married Correlation Chart
The statistical analysis conducted on geographies consisting of 123,509,767 people shows a slight negative correlation between the proportion of Estonians and percentage of population currently married in the United States with a correlation coefficient (R) of -0.058 and weighted average of 48.2%. Similarly, the statistical analysis conducted on geographies consisting of 119,394,885 people shows a slight positive correlation between the proportion of Immigrants from Albania and percentage of population currently married in the United States with a correlation coefficient (R) of 0.099 and weighted average of 45.9%, a difference of 5.0%.
Currently Married Correlation Summary
| Measurement | Estonian | Immigrants from Albania |
| Minimum | 13.5% | 30.7% |
| Maximum | 89.3% | 66.7% |
| Range | 75.8% | 36.0% |
| Mean | 53.8% | 48.1% |
| Median | 51.9% | 48.4% |
| Interquartile 25% (IQ1) | 48.1% | 43.7% |
| Interquartile 75% (IQ3) | 58.7% | 51.9% |
| Interquartile Range (IQR) | 10.6% | 8.2% |
| Standard Deviation (Sample) | 12.4% | 6.5% |
| Standard Deviation (Population) | 12.3% | 6.4% |
Similar Demographics by Currently Married
Demographics Similar to Estonians by Currently Married
In terms of currently married, the demographic groups most similar to Estonians are Immigrants from Eastern Asia (48.2%, a difference of 0.030%), Immigrants from Lebanon (48.2%, a difference of 0.050%), Immigrants from Belarus (48.1%, a difference of 0.070%), Basque (48.1%, a difference of 0.090%), and Slovene (48.1%, a difference of 0.11%).
| Demographics | Rating | Rank | Currently Married |
| Slovaks | 98.2 /100 | #67 | Exceptional 48.3% |
| Immigrants | England | 98.2 /100 | #68 | Exceptional 48.3% |
| Canadians | 98.1 /100 | #69 | Exceptional 48.3% |
| Immigrants | Asia | 97.9 /100 | #70 | Exceptional 48.3% |
| Macedonians | 97.9 /100 | #71 | Exceptional 48.3% |
| Immigrants | Lebanon | 97.6 /100 | #72 | Exceptional 48.2% |
| Immigrants | Eastern Asia | 97.5 /100 | #73 | Exceptional 48.2% |
| Estonians | 97.4 /100 | #74 | Exceptional 48.2% |
| Immigrants | Belarus | 97.2 /100 | #75 | Exceptional 48.1% |
| Basques | 97.2 /100 | #76 | Exceptional 48.1% |
| Slovenes | 97.1 /100 | #77 | Exceptional 48.1% |
| Immigrants | Belgium | 97.1 /100 | #78 | Exceptional 48.1% |
| Immigrants | South Africa | 97.0 /100 | #79 | Exceptional 48.1% |
| Immigrants | Poland | 96.9 /100 | #80 | Exceptional 48.1% |
| Immigrants | Sri Lanka | 96.9 /100 | #81 | Exceptional 48.1% |
Demographics Similar to Immigrants from Albania by Currently Married
In terms of currently married, the demographic groups most similar to Immigrants from Albania are Malaysian (45.9%, a difference of 0.060%), Creek (46.0%, a difference of 0.19%), Taiwanese (45.8%, a difference of 0.23%), Immigrants from Spain (45.8%, a difference of 0.24%), and South American Indian (45.8%, a difference of 0.25%).
| Demographics | Rating | Rank | Currently Married |
| Immigrants | Nepal | 23.7 /100 | #195 | Fair 46.1% |
| Immigrants | Bosnia and Herzegovina | 22.2 /100 | #196 | Fair 46.1% |
| Immigrants | Kuwait | 21.7 /100 | #197 | Fair 46.1% |
| Immigrants | Colombia | 21.0 /100 | #198 | Fair 46.1% |
| Immigrants | Costa Rica | 19.6 /100 | #199 | Poor 46.0% |
| Creek | 17.2 /100 | #200 | Poor 46.0% |
| Malaysians | 15.3 /100 | #201 | Poor 45.9% |
| Immigrants | Albania | 14.5 /100 | #202 | Poor 45.9% |
| Taiwanese | 11.7 /100 | #203 | Poor 45.8% |
| Immigrants | Spain | 11.6 /100 | #204 | Poor 45.8% |
| South American Indians | 11.5 /100 | #205 | Poor 45.8% |
| Immigrants | Immigrants | 11.2 /100 | #206 | Poor 45.8% |
| Immigrants | South America | 10.8 /100 | #207 | Poor 45.7% |
| Alsatians | 10.8 /100 | #208 | Poor 45.7% |
| Immigrants | Micronesia | 8.8 /100 | #209 | Tragic 45.6% |