Danish vs Aleut Average Family Size
COMPARE
Danish
Aleut
Average Family Size
Average Family Size Comparison
Danes
Aleuts
3.17
AVERAGE FAMILY SIZE
2.5/ 100
METRIC RATING
246th/ 347
METRIC RANK
3.23
AVERAGE FAMILY SIZE
54.1/ 100
METRIC RATING
169th/ 347
METRIC RANK
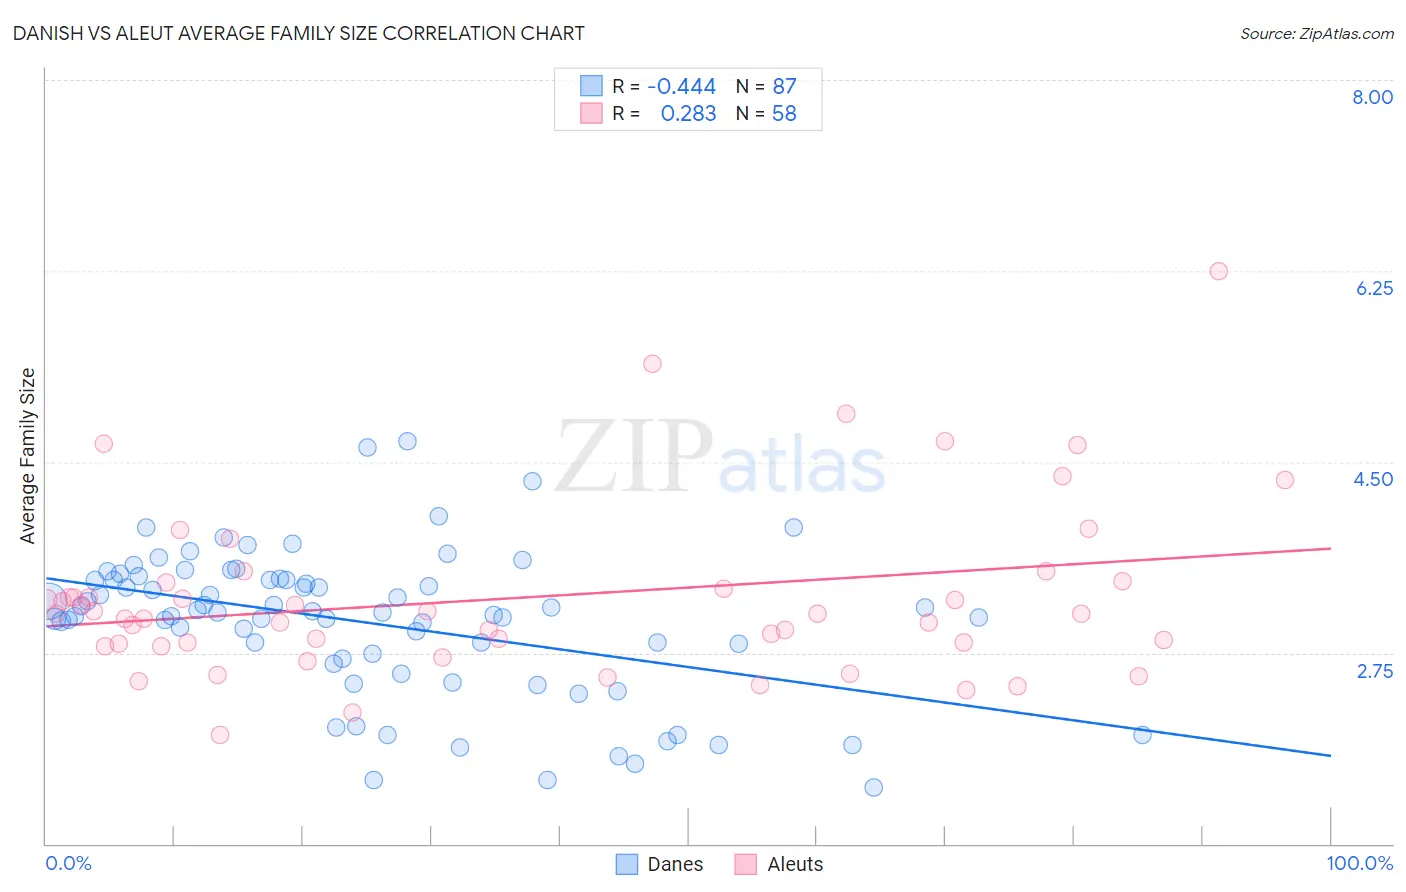
Danish vs Aleut Average Family Size Correlation Chart
The statistical analysis conducted on geographies consisting of 473,910,461 people shows a moderate negative correlation between the proportion of Danes and average family size in the United States with a correlation coefficient (R) of -0.444 and weighted average of 3.17. Similarly, the statistical analysis conducted on geographies consisting of 61,774,042 people shows a weak positive correlation between the proportion of Aleuts and average family size in the United States with a correlation coefficient (R) of 0.283 and weighted average of 3.23, a difference of 1.8%.
Average Family Size Correlation Summary
| Measurement | Danish | Aleut |
| Minimum | 1.52 | 2.00 |
| Maximum | 4.69 | 6.25 |
| Range | 3.17 | 4.25 |
| Mean | 3.03 | 3.26 |
| Median | 3.12 | 3.11 |
| Interquartile 25% (IQ1) | 2.69 | 2.84 |
| Interquartile 75% (IQ3) | 3.42 | 3.39 |
| Interquartile Range (IQR) | 0.73 | 0.55 |
| Standard Deviation (Sample) | 0.67 | 0.80 |
| Standard Deviation (Population) | 0.66 | 0.79 |
Similar Demographics by Average Family Size
Demographics Similar to Danes by Average Family Size
In terms of average family size, the demographic groups most similar to Danes are Cajun (3.17, a difference of 0.010%), Immigrants from Brazil (3.18, a difference of 0.040%), Immigrants from Belarus (3.17, a difference of 0.040%), Immigrants from Southern Europe (3.18, a difference of 0.070%), and Hungarian (3.18, a difference of 0.080%).
| Demographics | Rating | Rank | Average Family Size |
| Houma | 3.4 /100 | #239 | Tragic 3.18 |
| Osage | 3.2 /100 | #240 | Tragic 3.18 |
| Immigrants | Japan | 3.0 /100 | #241 | Tragic 3.18 |
| Hungarians | 3.0 /100 | #242 | Tragic 3.18 |
| Immigrants | Moldova | 2.9 /100 | #243 | Tragic 3.18 |
| Immigrants | Southern Europe | 2.9 /100 | #244 | Tragic 3.18 |
| Immigrants | Brazil | 2.7 /100 | #245 | Tragic 3.18 |
| Danes | 2.5 /100 | #246 | Tragic 3.17 |
| Cajuns | 2.4 /100 | #247 | Tragic 3.17 |
| Immigrants | Belarus | 2.3 /100 | #248 | Tragic 3.17 |
| Immigrants | Eastern Europe | 2.1 /100 | #249 | Tragic 3.17 |
| Puget Sound Salish | 1.9 /100 | #250 | Tragic 3.17 |
| Immigrants | Spain | 1.8 /100 | #251 | Tragic 3.17 |
| Immigrants | Saudi Arabia | 1.7 /100 | #252 | Tragic 3.17 |
| South Africans | 1.7 /100 | #253 | Tragic 3.17 |
Demographics Similar to Aleuts by Average Family Size
In terms of average family size, the demographic groups most similar to Aleuts are Taiwanese (3.23, a difference of 0.0%), Arab (3.23, a difference of 0.010%), Chilean (3.23, a difference of 0.020%), Immigrants from Congo (3.23, a difference of 0.030%), and Immigrants from Uruguay (3.23, a difference of 0.040%).
| Demographics | Rating | Rank | Average Family Size |
| Immigrants | Uganda | 60.1 /100 | #162 | Good 3.23 |
| Uruguayans | 58.8 /100 | #163 | Average 3.23 |
| Egyptians | 58.6 /100 | #164 | Average 3.23 |
| Ugandans | 58.4 /100 | #165 | Average 3.23 |
| Immigrants | Senegal | 57.5 /100 | #166 | Average 3.23 |
| Dutch West Indians | 56.9 /100 | #167 | Average 3.23 |
| Taiwanese | 54.2 /100 | #168 | Average 3.23 |
| Aleuts | 54.1 /100 | #169 | Average 3.23 |
| Arabs | 53.8 /100 | #170 | Average 3.23 |
| Chileans | 53.2 /100 | #171 | Average 3.23 |
| Immigrants | Congo | 52.7 /100 | #172 | Average 3.23 |
| Immigrants | Uruguay | 52.0 /100 | #173 | Average 3.23 |
| Immigrants | South Central Asia | 50.0 /100 | #174 | Average 3.23 |
| Immigrants | China | 49.9 /100 | #175 | Average 3.23 |
| Israelis | 48.7 /100 | #176 | Average 3.23 |