Danish vs Immigrants from Thailand Average Family Size
COMPARE
Danish
Immigrants from Thailand
Average Family Size
Average Family Size Comparison
Danes
Immigrants from Thailand
3.17
AVERAGE FAMILY SIZE
2.5/ 100
METRIC RATING
246th/ 347
METRIC RANK
3.27
AVERAGE FAMILY SIZE
93.3/ 100
METRIC RATING
121st/ 347
METRIC RANK
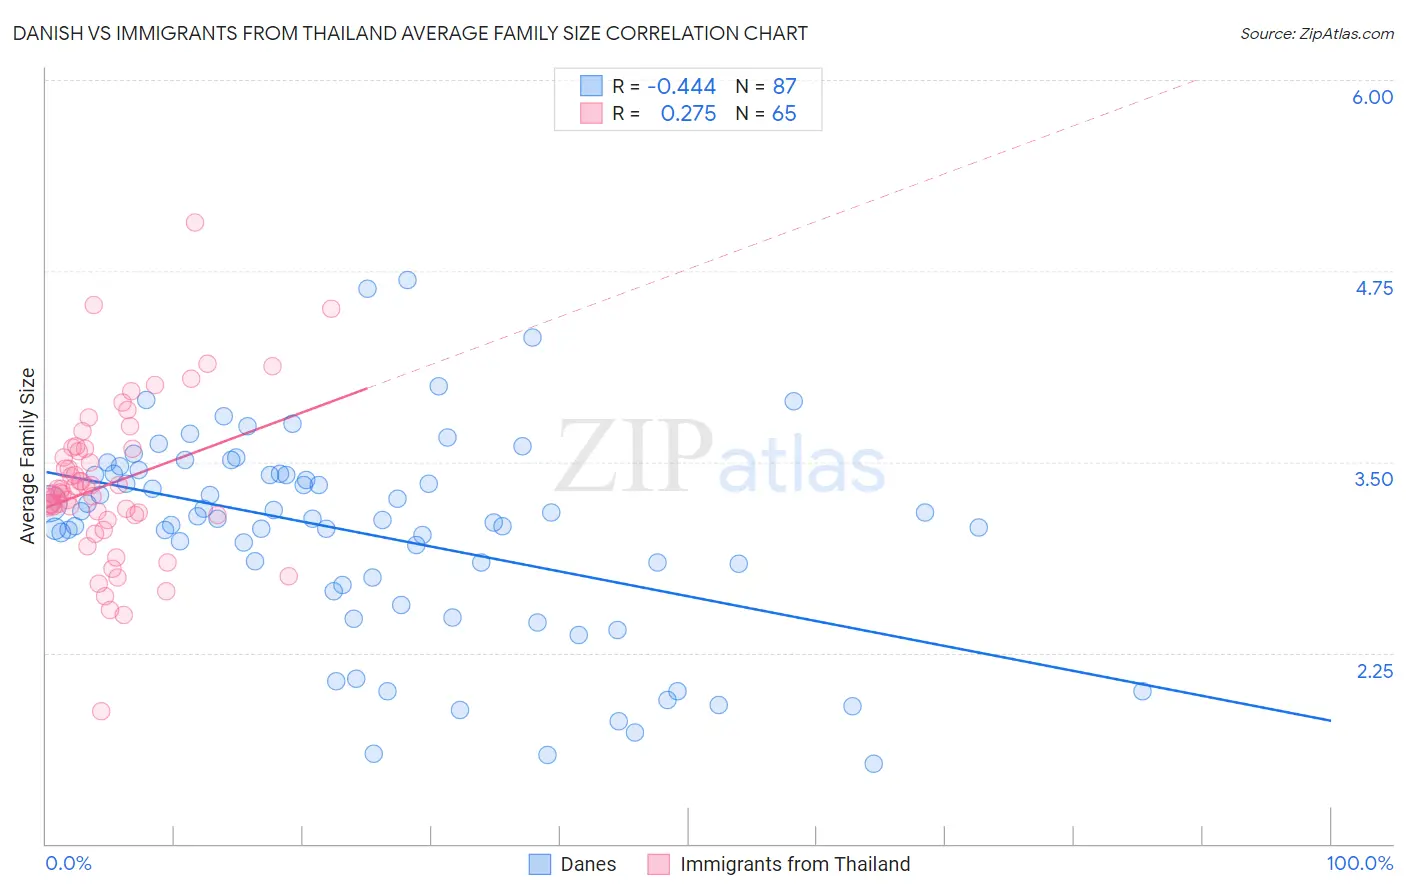
Danish vs Immigrants from Thailand Average Family Size Correlation Chart
The statistical analysis conducted on geographies consisting of 473,910,461 people shows a moderate negative correlation between the proportion of Danes and average family size in the United States with a correlation coefficient (R) of -0.444 and weighted average of 3.17. Similarly, the statistical analysis conducted on geographies consisting of 316,926,842 people shows a weak positive correlation between the proportion of Immigrants from Thailand and average family size in the United States with a correlation coefficient (R) of 0.275 and weighted average of 3.27, a difference of 2.9%.
Average Family Size Correlation Summary
| Measurement | Danish | Immigrants from Thailand |
| Minimum | 1.52 | 1.87 |
| Maximum | 4.69 | 5.07 |
| Range | 3.17 | 3.20 |
| Mean | 3.03 | 3.35 |
| Median | 3.12 | 3.30 |
| Interquartile 25% (IQ1) | 2.69 | 3.15 |
| Interquartile 75% (IQ3) | 3.42 | 3.59 |
| Interquartile Range (IQR) | 0.73 | 0.44 |
| Standard Deviation (Sample) | 0.67 | 0.51 |
| Standard Deviation (Population) | 0.66 | 0.51 |
Similar Demographics by Average Family Size
Demographics Similar to Danes by Average Family Size
In terms of average family size, the demographic groups most similar to Danes are Cajun (3.17, a difference of 0.010%), Immigrants from Brazil (3.18, a difference of 0.040%), Immigrants from Belarus (3.17, a difference of 0.040%), Immigrants from Southern Europe (3.18, a difference of 0.070%), and Hungarian (3.18, a difference of 0.080%).
| Demographics | Rating | Rank | Average Family Size |
| Houma | 3.4 /100 | #239 | Tragic 3.18 |
| Osage | 3.2 /100 | #240 | Tragic 3.18 |
| Immigrants | Japan | 3.0 /100 | #241 | Tragic 3.18 |
| Hungarians | 3.0 /100 | #242 | Tragic 3.18 |
| Immigrants | Moldova | 2.9 /100 | #243 | Tragic 3.18 |
| Immigrants | Southern Europe | 2.9 /100 | #244 | Tragic 3.18 |
| Immigrants | Brazil | 2.7 /100 | #245 | Tragic 3.18 |
| Danes | 2.5 /100 | #246 | Tragic 3.17 |
| Cajuns | 2.4 /100 | #247 | Tragic 3.17 |
| Immigrants | Belarus | 2.3 /100 | #248 | Tragic 3.17 |
| Immigrants | Eastern Europe | 2.1 /100 | #249 | Tragic 3.17 |
| Puget Sound Salish | 1.9 /100 | #250 | Tragic 3.17 |
| Immigrants | Spain | 1.8 /100 | #251 | Tragic 3.17 |
| Immigrants | Saudi Arabia | 1.7 /100 | #252 | Tragic 3.17 |
| South Africans | 1.7 /100 | #253 | Tragic 3.17 |
Demographics Similar to Immigrants from Thailand by Average Family Size
In terms of average family size, the demographic groups most similar to Immigrants from Thailand are Immigrants from Bahamas (3.27, a difference of 0.020%), Immigrants from Colombia (3.27, a difference of 0.030%), Immigrants from Indonesia (3.27, a difference of 0.040%), Immigrants from Asia (3.27, a difference of 0.050%), and Alaskan Athabascan (3.27, a difference of 0.060%).
| Demographics | Rating | Rank | Average Family Size |
| South Americans | 95.1 /100 | #114 | Exceptional 3.27 |
| Immigrants | Liberia | 95.0 /100 | #115 | Exceptional 3.27 |
| Immigrants | South America | 95.0 /100 | #116 | Exceptional 3.27 |
| Kiowa | 94.8 /100 | #117 | Exceptional 3.27 |
| Immigrants | Asia | 94.0 /100 | #118 | Exceptional 3.27 |
| Immigrants | Indonesia | 93.7 /100 | #119 | Exceptional 3.27 |
| Immigrants | Bahamas | 93.6 /100 | #120 | Exceptional 3.27 |
| Immigrants | Thailand | 93.3 /100 | #121 | Exceptional 3.27 |
| Immigrants | Colombia | 92.8 /100 | #122 | Exceptional 3.27 |
| Alaskan Athabascans | 92.4 /100 | #123 | Exceptional 3.27 |
| South American Indians | 91.6 /100 | #124 | Exceptional 3.26 |
| Immigrants | Cuba | 91.3 /100 | #125 | Exceptional 3.26 |
| Immigrants | Costa Rica | 90.7 /100 | #126 | Exceptional 3.26 |
| Immigrants | Syria | 90.6 /100 | #127 | Exceptional 3.26 |
| Colombians | 89.9 /100 | #128 | Excellent 3.26 |