Czechoslovakian vs Ugandan Nursery School
COMPARE
Czechoslovakian
Ugandan
Nursery School
Nursery School Comparison
Czechoslovakians
Ugandans
98.5%
NURSERY SCHOOL
99.9/ 100
METRIC RATING
47th/ 347
METRIC RANK
98.0%
NURSERY SCHOOL
56.4/ 100
METRIC RATING
164th/ 347
METRIC RANK
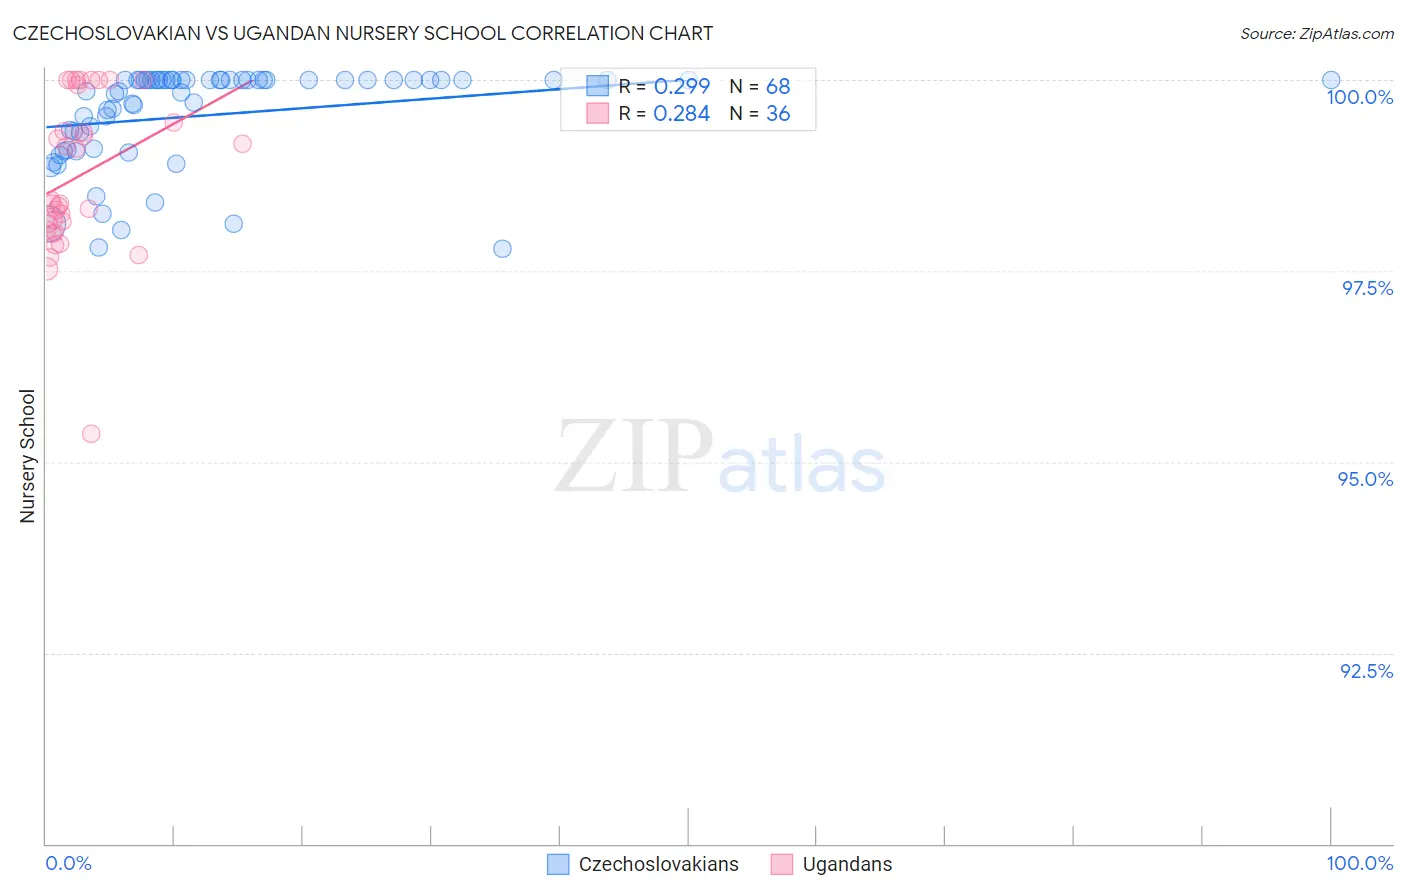
Czechoslovakian vs Ugandan Nursery School Correlation Chart
The statistical analysis conducted on geographies consisting of 368,666,701 people shows a weak positive correlation between the proportion of Czechoslovakians and percentage of population with at least nursery school education in the United States with a correlation coefficient (R) of 0.299 and weighted average of 98.5%. Similarly, the statistical analysis conducted on geographies consisting of 93,991,892 people shows a weak positive correlation between the proportion of Ugandans and percentage of population with at least nursery school education in the United States with a correlation coefficient (R) of 0.284 and weighted average of 98.0%, a difference of 0.47%.
Nursery School Correlation Summary
| Measurement | Czechoslovakian | Ugandan |
| Minimum | 97.8% | 95.4% |
| Maximum | 100.0% | 100.0% |
| Range | 2.2% | 4.6% |
| Mean | 99.5% | 98.7% |
| Median | 100.0% | 98.4% |
| Interquartile 25% (IQ1) | 99.1% | 98.1% |
| Interquartile 75% (IQ3) | 100.0% | 99.7% |
| Interquartile Range (IQR) | 0.90% | 1.6% |
| Standard Deviation (Sample) | 0.64% | 1.0% |
| Standard Deviation (Population) | 0.64% | 1.0% |
Similar Demographics by Nursery School
Demographics Similar to Czechoslovakians by Nursery School
In terms of nursery school, the demographic groups most similar to Czechoslovakians are Ottawa (98.5%, a difference of 0.010%), White/Caucasian (98.5%, a difference of 0.010%), Celtic (98.5%, a difference of 0.010%), Estonian (98.5%, a difference of 0.010%), and Australian (98.5%, a difference of 0.010%).
| Demographics | Rating | Rank | Nursery School |
| Chippewa | 99.9 /100 | #40 | Exceptional 98.5% |
| Luxembourgers | 99.9 /100 | #41 | Exceptional 98.5% |
| Eastern Europeans | 99.9 /100 | #42 | Exceptional 98.5% |
| Native Hawaiians | 99.9 /100 | #43 | Exceptional 98.5% |
| Belgians | 99.9 /100 | #44 | Exceptional 98.5% |
| Northern Europeans | 99.9 /100 | #45 | Exceptional 98.5% |
| Hungarians | 99.9 /100 | #46 | Exceptional 98.5% |
| Czechoslovakians | 99.9 /100 | #47 | Exceptional 98.5% |
| Ottawa | 99.8 /100 | #48 | Exceptional 98.5% |
| Whites/Caucasians | 99.8 /100 | #49 | Exceptional 98.5% |
| Celtics | 99.8 /100 | #50 | Exceptional 98.5% |
| Estonians | 99.8 /100 | #51 | Exceptional 98.5% |
| Australians | 99.8 /100 | #52 | Exceptional 98.5% |
| Kiowa | 99.8 /100 | #53 | Exceptional 98.4% |
| Pueblo | 99.8 /100 | #54 | Exceptional 98.4% |
Demographics Similar to Ugandans by Nursery School
In terms of nursery school, the demographic groups most similar to Ugandans are Chilean (98.0%, a difference of 0.0%), Spanish American (98.0%, a difference of 0.0%), Immigrants from Spain (98.0%, a difference of 0.0%), Immigrants from Micronesia (98.0%, a difference of 0.0%), and Immigrants from Russia (98.0%, a difference of 0.010%).
| Demographics | Rating | Rank | Nursery School |
| Comanche | 66.0 /100 | #157 | Good 98.0% |
| Immigrants | North Macedonia | 65.7 /100 | #158 | Good 98.0% |
| French American Indians | 62.1 /100 | #159 | Good 98.0% |
| Immigrants | Russia | 59.9 /100 | #160 | Average 98.0% |
| Immigrants | Eastern Europe | 59.7 /100 | #161 | Average 98.0% |
| Brazilians | 59.4 /100 | #162 | Average 98.0% |
| Immigrants | Italy | 59.0 /100 | #163 | Average 98.0% |
| Ugandans | 56.4 /100 | #164 | Average 98.0% |
| Chileans | 56.4 /100 | #165 | Average 98.0% |
| Spanish Americans | 55.6 /100 | #166 | Average 98.0% |
| Immigrants | Spain | 55.6 /100 | #167 | Average 98.0% |
| Immigrants | Micronesia | 55.0 /100 | #168 | Average 98.0% |
| Immigrants | Korea | 53.8 /100 | #169 | Average 98.0% |
| Bermudans | 53.7 /100 | #170 | Average 98.0% |
| Immigrants | Jordan | 53.4 /100 | #171 | Average 98.0% |