Czechoslovakian vs Osage Family Households
COMPARE
Czechoslovakian
Osage
Family Households
Family Households Comparison
Czechoslovakians
Osage
64.6%
FAMILY HOUSEHOLDS
82.1/ 100
METRIC RATING
143rd/ 347
METRIC RANK
63.7%
FAMILY HOUSEHOLDS
7.0/ 100
METRIC RATING
217th/ 347
METRIC RANK
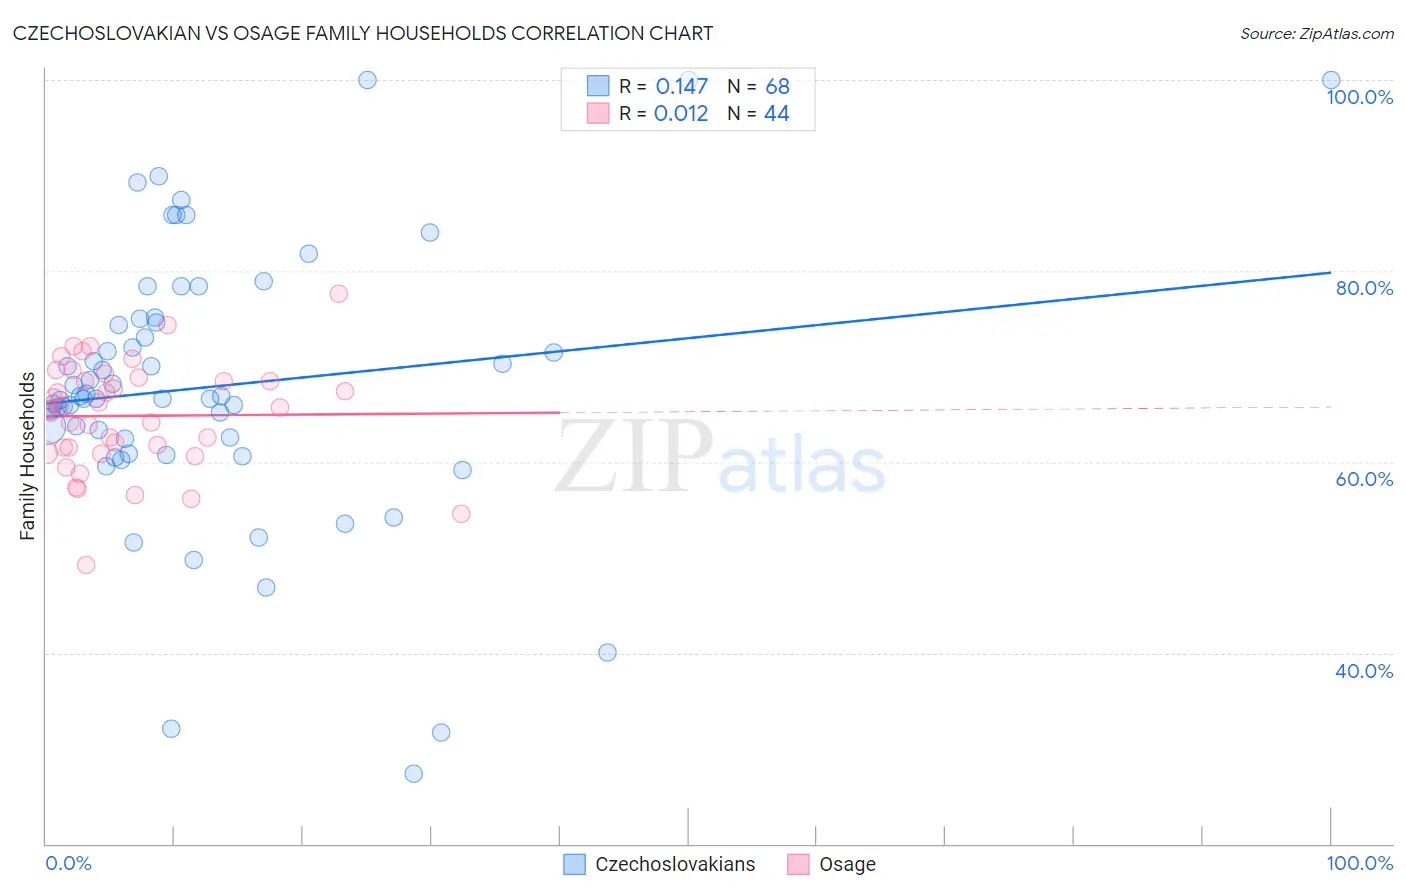
Czechoslovakian vs Osage Family Households Correlation Chart
The statistical analysis conducted on geographies consisting of 368,525,502 people shows a poor positive correlation between the proportion of Czechoslovakians and percentage of family households in the United States with a correlation coefficient (R) of 0.147 and weighted average of 64.6%. Similarly, the statistical analysis conducted on geographies consisting of 91,796,062 people shows no correlation between the proportion of Osage and percentage of family households in the United States with a correlation coefficient (R) of 0.012 and weighted average of 63.7%, a difference of 1.4%.
Family Households Correlation Summary
| Measurement | Czechoslovakian | Osage |
| Minimum | 27.4% | 49.2% |
| Maximum | 100.0% | 77.6% |
| Range | 72.6% | 28.5% |
| Mean | 67.9% | 64.8% |
| Median | 66.7% | 65.7% |
| Interquartile 25% (IQ1) | 61.6% | 61.3% |
| Interquartile 75% (IQ3) | 74.8% | 68.7% |
| Interquartile Range (IQR) | 13.1% | 7.4% |
| Standard Deviation (Sample) | 14.4% | 5.7% |
| Standard Deviation (Population) | 14.3% | 5.7% |
Similar Demographics by Family Households
Demographics Similar to Czechoslovakians by Family Households
In terms of family households, the demographic groups most similar to Czechoslovakians are South American Indian (64.6%, a difference of 0.0%), Welsh (64.6%, a difference of 0.040%), Pakistani (64.7%, a difference of 0.050%), Immigrants from North Macedonia (64.7%, a difference of 0.070%), and Immigrants from Cameroon (64.7%, a difference of 0.070%).
| Demographics | Rating | Rank | Family Households |
| Immigrants | China | 86.6 /100 | #136 | Excellent 64.7% |
| Immigrants | Scotland | 86.4 /100 | #137 | Excellent 64.7% |
| Basques | 85.5 /100 | #138 | Excellent 64.7% |
| Immigrants | Jamaica | 85.3 /100 | #139 | Excellent 64.7% |
| Immigrants | North Macedonia | 84.9 /100 | #140 | Excellent 64.7% |
| Immigrants | Cameroon | 84.8 /100 | #141 | Excellent 64.7% |
| Pakistanis | 84.0 /100 | #142 | Excellent 64.7% |
| Czechoslovakians | 82.1 /100 | #143 | Excellent 64.6% |
| South American Indians | 81.9 /100 | #144 | Excellent 64.6% |
| Welsh | 80.1 /100 | #145 | Excellent 64.6% |
| Immigrants | Romania | 77.0 /100 | #146 | Good 64.6% |
| Immigrants | Chile | 76.5 /100 | #147 | Good 64.6% |
| Delaware | 76.3 /100 | #148 | Good 64.6% |
| Sioux | 76.3 /100 | #149 | Good 64.6% |
| Romanians | 75.3 /100 | #150 | Good 64.5% |
Demographics Similar to Osage by Family Households
In terms of family households, the demographic groups most similar to Osage are Marshallese (63.7%, a difference of 0.0%), Croatian (63.8%, a difference of 0.010%), Belgian (63.8%, a difference of 0.030%), Macedonian (63.7%, a difference of 0.030%), and Immigrants from Europe (63.7%, a difference of 0.030%).
| Demographics | Rating | Rank | Family Households |
| Immigrants | Thailand | 9.6 /100 | #210 | Tragic 63.8% |
| Shoshone | 9.4 /100 | #211 | Tragic 63.8% |
| Immigrants | Netherlands | 9.4 /100 | #212 | Tragic 63.8% |
| Immigrants | Northern Europe | 8.8 /100 | #213 | Tragic 63.8% |
| Celtics | 8.0 /100 | #214 | Tragic 63.8% |
| Belgians | 7.6 /100 | #215 | Tragic 63.8% |
| Croatians | 7.3 /100 | #216 | Tragic 63.8% |
| Osage | 7.0 /100 | #217 | Tragic 63.7% |
| Marshallese | 6.9 /100 | #218 | Tragic 63.7% |
| Macedonians | 6.5 /100 | #219 | Tragic 63.7% |
| Immigrants | Europe | 6.4 /100 | #220 | Tragic 63.7% |
| Immigrants | South Africa | 5.9 /100 | #221 | Tragic 63.7% |
| Immigrants | Belarus | 5.5 /100 | #222 | Tragic 63.7% |
| French Canadians | 5.4 /100 | #223 | Tragic 63.7% |
| Turks | 4.5 /100 | #224 | Tragic 63.6% |