Immigrants from Russia vs Immigrants from Bolivia Currently Married
COMPARE
Immigrants from Russia
Immigrants from Bolivia
Currently Married
Currently Married Comparison
Immigrants from Russia
Immigrants from Bolivia
47.7%
CURRENTLY MARRIED
92.0/ 100
METRIC RATING
110th/ 347
METRIC RANK
47.9%
CURRENTLY MARRIED
95.6/ 100
METRIC RATING
91st/ 347
METRIC RANK
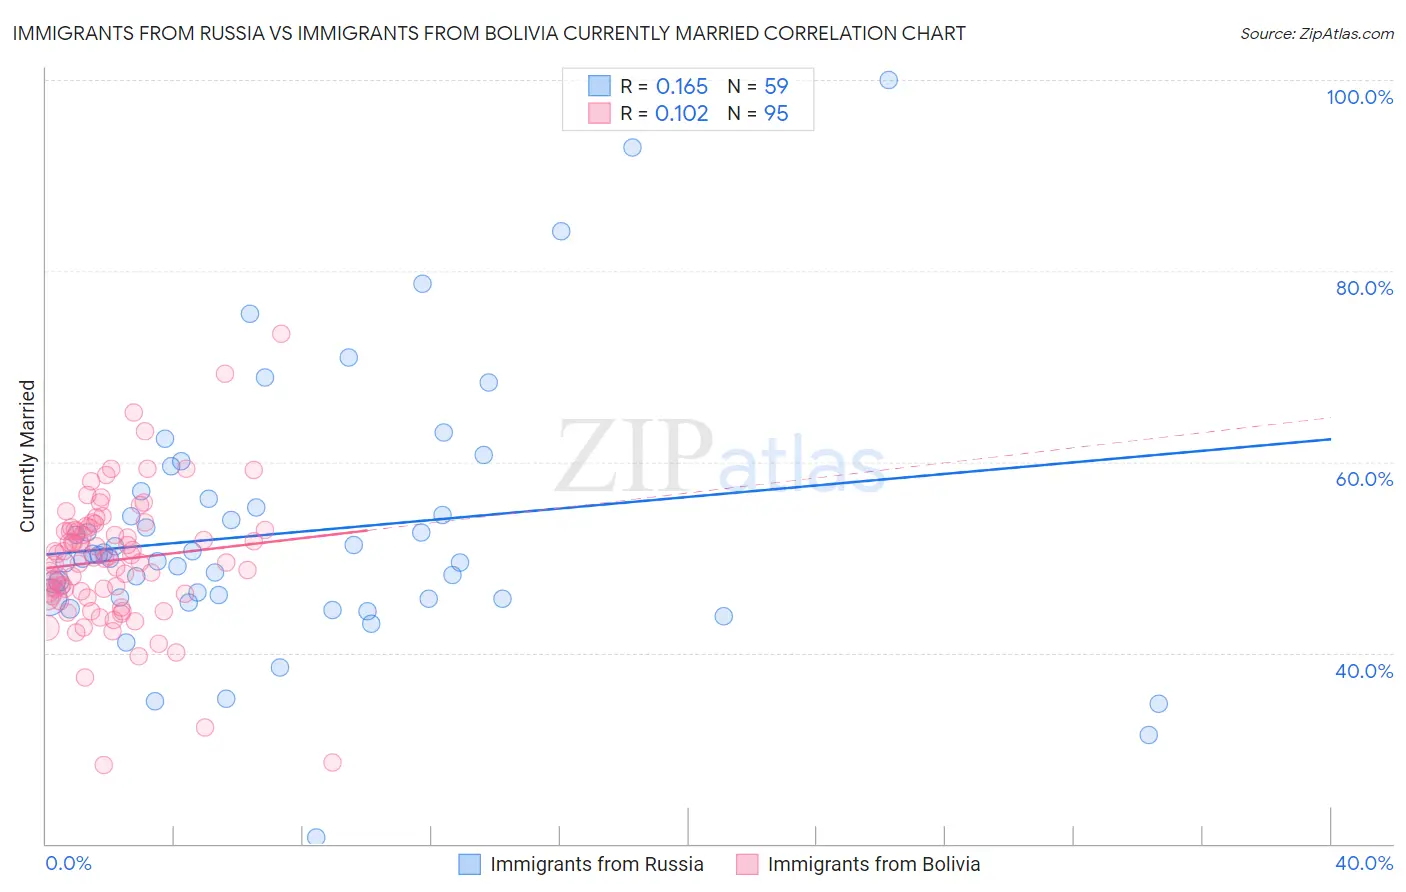
Immigrants from Russia vs Immigrants from Bolivia Currently Married Correlation Chart
The statistical analysis conducted on geographies consisting of 347,902,051 people shows a poor positive correlation between the proportion of Immigrants from Russia and percentage of population currently married in the United States with a correlation coefficient (R) of 0.165 and weighted average of 47.7%. Similarly, the statistical analysis conducted on geographies consisting of 158,725,888 people shows a poor positive correlation between the proportion of Immigrants from Bolivia and percentage of population currently married in the United States with a correlation coefficient (R) of 0.102 and weighted average of 47.9%, a difference of 0.57%.
Currently Married Correlation Summary
| Measurement | Immigrants from Russia | Immigrants from Bolivia |
| Minimum | 20.6% | 28.3% |
| Maximum | 100.0% | 73.4% |
| Range | 79.4% | 45.1% |
| Mean | 52.6% | 49.7% |
| Median | 49.9% | 50.0% |
| Interquartile 25% (IQ1) | 45.6% | 45.9% |
| Interquartile 75% (IQ3) | 56.2% | 53.1% |
| Interquartile Range (IQR) | 10.6% | 7.2% |
| Standard Deviation (Sample) | 13.7% | 7.0% |
| Standard Deviation (Population) | 13.6% | 7.0% |
Demographics Similar to Immigrants from Russia and Immigrants from Bolivia by Currently Married
In terms of currently married, the demographic groups most similar to Immigrants from Russia are Immigrants from Egypt (47.7%, a difference of 0.040%), Tsimshian (47.7%, a difference of 0.050%), Immigrants from Italy (47.7%, a difference of 0.11%), Immigrants from Greece (47.7%, a difference of 0.14%), and Immigrants from Singapore (47.8%, a difference of 0.17%). Similarly, the demographic groups most similar to Immigrants from Bolivia are American (48.0%, a difference of 0.030%), Korean (47.9%, a difference of 0.040%), Lebanese (47.9%, a difference of 0.090%), Native Hawaiian (47.9%, a difference of 0.11%), and Immigrants from Bulgaria (47.9%, a difference of 0.14%).
| Demographics | Rating | Rank | Currently Married |
| Americans | 95.7 /100 | #90 | Exceptional 48.0% |
| Immigrants | Bolivia | 95.6 /100 | #91 | Exceptional 47.9% |
| Koreans | 95.4 /100 | #92 | Exceptional 47.9% |
| Lebanese | 95.1 /100 | #93 | Exceptional 47.9% |
| Native Hawaiians | 95.0 /100 | #94 | Exceptional 47.9% |
| Immigrants | Bulgaria | 94.8 /100 | #95 | Exceptional 47.9% |
| Egyptians | 94.8 /100 | #96 | Exceptional 47.9% |
| Immigrants | Ukraine | 94.8 /100 | #97 | Exceptional 47.9% |
| Immigrants | China | 94.7 /100 | #98 | Exceptional 47.9% |
| Immigrants | Sweden | 94.3 /100 | #99 | Exceptional 47.8% |
| Celtics | 94.2 /100 | #100 | Exceptional 47.8% |
| Immigrants | Germany | 94.1 /100 | #101 | Exceptional 47.8% |
| Turks | 93.9 /100 | #102 | Exceptional 47.8% |
| Cypriots | 93.7 /100 | #103 | Exceptional 47.8% |
| Serbians | 93.6 /100 | #104 | Exceptional 47.8% |
| Immigrants | Singapore | 93.3 /100 | #105 | Exceptional 47.8% |
| Immigrants | Greece | 93.1 /100 | #106 | Exceptional 47.7% |
| Immigrants | Italy | 92.9 /100 | #107 | Exceptional 47.7% |
| Tsimshian | 92.4 /100 | #108 | Exceptional 47.7% |
| Immigrants | Egypt | 92.3 /100 | #109 | Exceptional 47.7% |
| Immigrants | Russia | 92.0 /100 | #110 | Exceptional 47.7% |