Moroccan vs Immigrants from Bolivia Currently Married
COMPARE
Moroccan
Immigrants from Bolivia
Currently Married
Currently Married Comparison
Moroccans
Immigrants from Bolivia
44.6%
CURRENTLY MARRIED
0.9/ 100
METRIC RATING
238th/ 347
METRIC RANK
47.9%
CURRENTLY MARRIED
95.6/ 100
METRIC RATING
91st/ 347
METRIC RANK
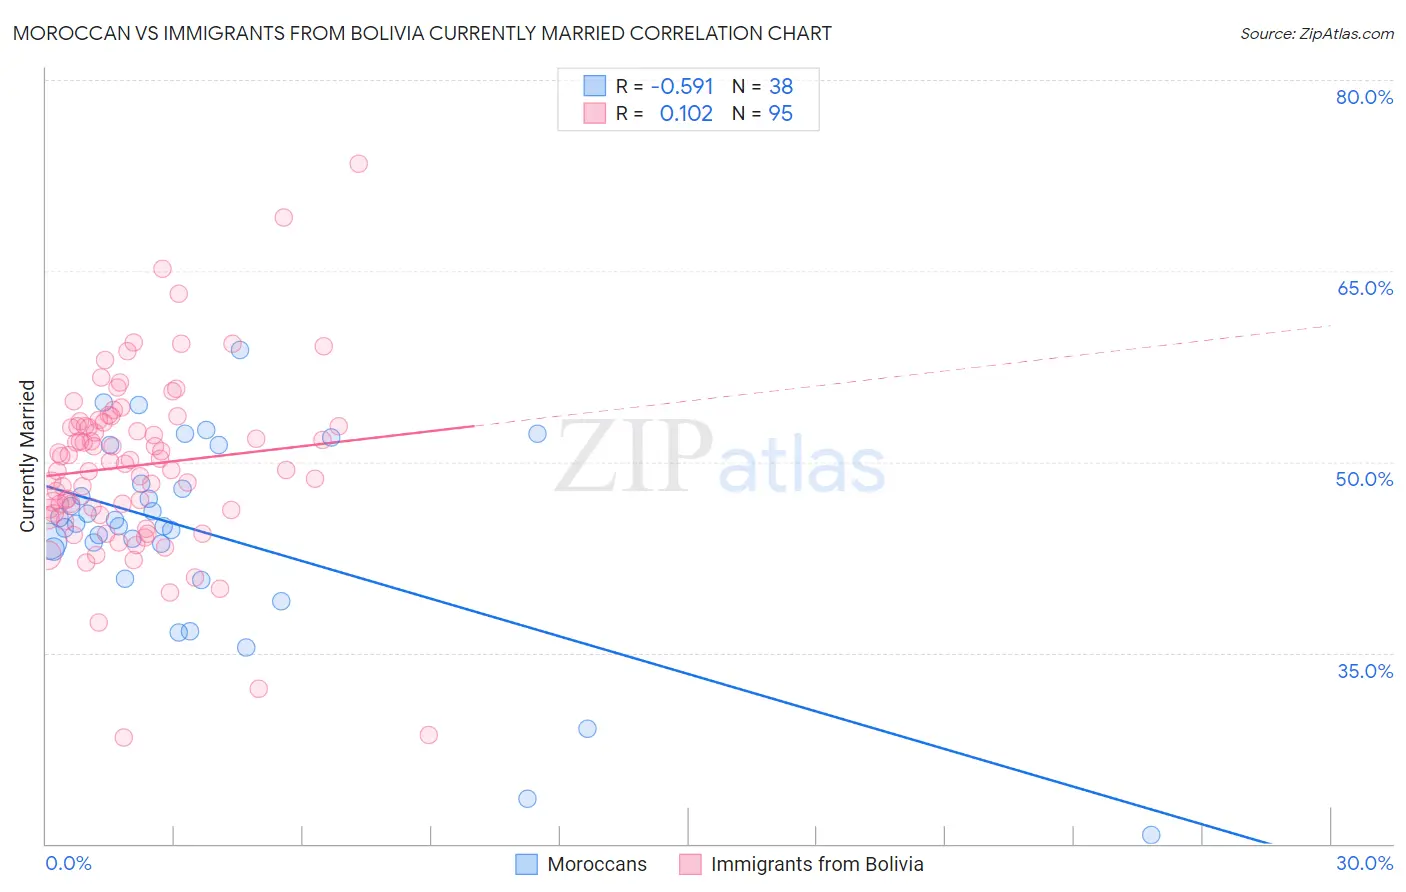
Moroccan vs Immigrants from Bolivia Currently Married Correlation Chart
The statistical analysis conducted on geographies consisting of 201,812,139 people shows a substantial negative correlation between the proportion of Moroccans and percentage of population currently married in the United States with a correlation coefficient (R) of -0.591 and weighted average of 44.6%. Similarly, the statistical analysis conducted on geographies consisting of 158,725,888 people shows a poor positive correlation between the proportion of Immigrants from Bolivia and percentage of population currently married in the United States with a correlation coefficient (R) of 0.102 and weighted average of 47.9%, a difference of 7.5%.
Currently Married Correlation Summary
| Measurement | Moroccan | Immigrants from Bolivia |
| Minimum | 20.7% | 28.3% |
| Maximum | 58.8% | 73.4% |
| Range | 38.1% | 45.1% |
| Mean | 44.4% | 49.7% |
| Median | 45.0% | 50.0% |
| Interquartile 25% (IQ1) | 43.1% | 45.9% |
| Interquartile 75% (IQ3) | 48.3% | 53.1% |
| Interquartile Range (IQR) | 5.2% | 7.2% |
| Standard Deviation (Sample) | 7.9% | 7.0% |
| Standard Deviation (Population) | 7.8% | 7.0% |
Similar Demographics by Currently Married
Demographics Similar to Moroccans by Currently Married
In terms of currently married, the demographic groups most similar to Moroccans are Cuban (44.6%, a difference of 0.080%), Seminole (44.6%, a difference of 0.080%), Alaskan Athabascan (44.6%, a difference of 0.090%), Immigrants from Mexico (44.5%, a difference of 0.14%), and Mexican American Indian (44.5%, a difference of 0.14%).
| Demographics | Rating | Rank | Currently Married |
| Immigrants | Panama | 1.5 /100 | #231 | Tragic 44.9% |
| Nepalese | 1.2 /100 | #232 | Tragic 44.7% |
| Immigrants | Saudi Arabia | 1.1 /100 | #233 | Tragic 44.7% |
| Iroquois | 1.1 /100 | #234 | Tragic 44.7% |
| Alaskan Athabascans | 0.9 /100 | #235 | Tragic 44.6% |
| Cubans | 0.9 /100 | #236 | Tragic 44.6% |
| Seminole | 0.9 /100 | #237 | Tragic 44.6% |
| Moroccans | 0.9 /100 | #238 | Tragic 44.6% |
| Immigrants | Mexico | 0.7 /100 | #239 | Tragic 44.5% |
| Mexican American Indians | 0.7 /100 | #240 | Tragic 44.5% |
| Ethiopians | 0.7 /100 | #241 | Tragic 44.5% |
| Immigrants | Cambodia | 0.7 /100 | #242 | Tragic 44.5% |
| Immigrants | Ethiopia | 0.7 /100 | #243 | Tragic 44.5% |
| Japanese | 0.6 /100 | #244 | Tragic 44.5% |
| Immigrants | Armenia | 0.4 /100 | #245 | Tragic 44.3% |
Demographics Similar to Immigrants from Bolivia by Currently Married
In terms of currently married, the demographic groups most similar to Immigrants from Bolivia are American (48.0%, a difference of 0.030%), Korean (47.9%, a difference of 0.040%), Indian (Asian) (48.0%, a difference of 0.050%), Lebanese (47.9%, a difference of 0.090%), and Native Hawaiian (47.9%, a difference of 0.11%).
| Demographics | Rating | Rank | Currently Married |
| Immigrants | Israel | 96.9 /100 | #84 | Exceptional 48.1% |
| French Canadians | 96.3 /100 | #85 | Exceptional 48.0% |
| Immigrants | Japan | 96.2 /100 | #86 | Exceptional 48.0% |
| Jordanians | 96.2 /100 | #87 | Exceptional 48.0% |
| Immigrants | Eastern Europe | 96.1 /100 | #88 | Exceptional 48.0% |
| Indians (Asian) | 95.8 /100 | #89 | Exceptional 48.0% |
| Americans | 95.7 /100 | #90 | Exceptional 48.0% |
| Immigrants | Bolivia | 95.6 /100 | #91 | Exceptional 47.9% |
| Koreans | 95.4 /100 | #92 | Exceptional 47.9% |
| Lebanese | 95.1 /100 | #93 | Exceptional 47.9% |
| Native Hawaiians | 95.0 /100 | #94 | Exceptional 47.9% |
| Immigrants | Bulgaria | 94.8 /100 | #95 | Exceptional 47.9% |
| Egyptians | 94.8 /100 | #96 | Exceptional 47.9% |
| Immigrants | Ukraine | 94.8 /100 | #97 | Exceptional 47.9% |
| Immigrants | China | 94.7 /100 | #98 | Exceptional 47.9% |