Shoshone vs Immigrants from Bolivia Currently Married
COMPARE
Shoshone
Immigrants from Bolivia
Currently Married
Currently Married Comparison
Shoshone
Immigrants from Bolivia
44.0%
CURRENTLY MARRIED
0.2/ 100
METRIC RATING
256th/ 347
METRIC RANK
47.9%
CURRENTLY MARRIED
95.6/ 100
METRIC RATING
91st/ 347
METRIC RANK
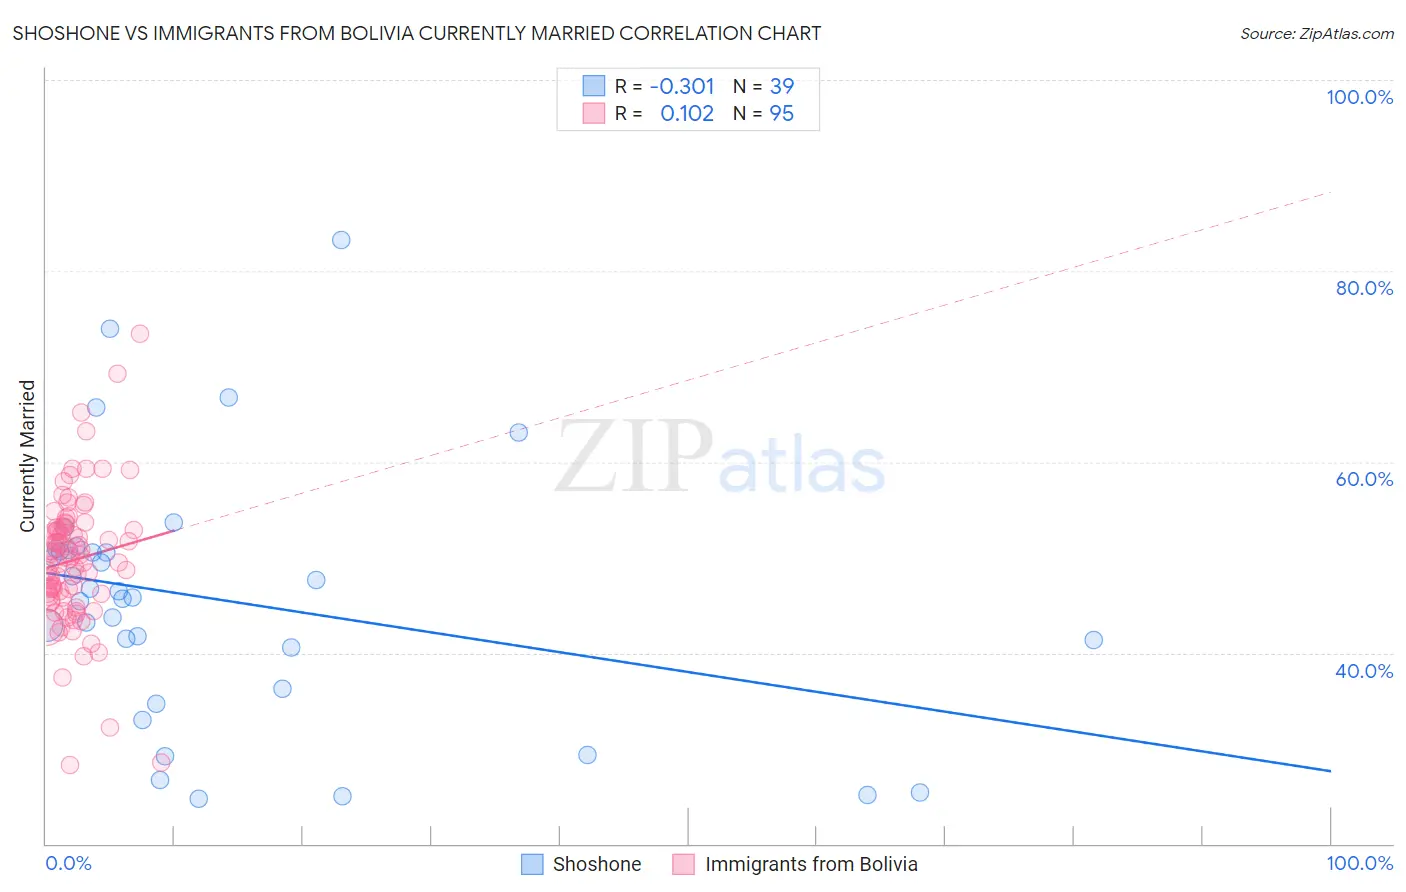
Shoshone vs Immigrants from Bolivia Currently Married Correlation Chart
The statistical analysis conducted on geographies consisting of 66,627,152 people shows a mild negative correlation between the proportion of Shoshone and percentage of population currently married in the United States with a correlation coefficient (R) of -0.301 and weighted average of 44.0%. Similarly, the statistical analysis conducted on geographies consisting of 158,725,888 people shows a poor positive correlation between the proportion of Immigrants from Bolivia and percentage of population currently married in the United States with a correlation coefficient (R) of 0.102 and weighted average of 47.9%, a difference of 9.0%.
Currently Married Correlation Summary
| Measurement | Shoshone | Immigrants from Bolivia |
| Minimum | 24.7% | 28.3% |
| Maximum | 83.3% | 73.4% |
| Range | 58.6% | 45.1% |
| Mean | 45.5% | 49.7% |
| Median | 45.8% | 50.0% |
| Interquartile 25% (IQ1) | 36.3% | 45.9% |
| Interquartile 75% (IQ3) | 50.8% | 53.1% |
| Interquartile Range (IQR) | 14.5% | 7.2% |
| Standard Deviation (Sample) | 13.3% | 7.0% |
| Standard Deviation (Population) | 13.2% | 7.0% |
Similar Demographics by Currently Married
Demographics Similar to Shoshone by Currently Married
In terms of currently married, the demographic groups most similar to Shoshone are Yakama (44.0%, a difference of 0.050%), Vietnamese (44.0%, a difference of 0.12%), Immigrants from Africa (43.9%, a difference of 0.20%), Ute (43.9%, a difference of 0.21%), and Immigrants from Central America (44.1%, a difference of 0.37%).
| Demographics | Rating | Rank | Currently Married |
| Immigrants | Cameroon | 0.3 /100 | #249 | Tragic 44.2% |
| Immigrants | Eastern Africa | 0.3 /100 | #250 | Tragic 44.2% |
| Blackfeet | 0.3 /100 | #251 | Tragic 44.2% |
| Hispanics or Latinos | 0.3 /100 | #252 | Tragic 44.1% |
| Immigrants | Central America | 0.3 /100 | #253 | Tragic 44.1% |
| Vietnamese | 0.2 /100 | #254 | Tragic 44.0% |
| Yakama | 0.2 /100 | #255 | Tragic 44.0% |
| Shoshone | 0.2 /100 | #256 | Tragic 44.0% |
| Immigrants | Africa | 0.2 /100 | #257 | Tragic 43.9% |
| Ute | 0.2 /100 | #258 | Tragic 43.9% |
| Immigrants | Sierra Leone | 0.1 /100 | #259 | Tragic 43.8% |
| Immigrants | Latin America | 0.1 /100 | #260 | Tragic 43.8% |
| Immigrants | Nicaragua | 0.1 /100 | #261 | Tragic 43.7% |
| Bangladeshis | 0.1 /100 | #262 | Tragic 43.7% |
| Immigrants | Cuba | 0.1 /100 | #263 | Tragic 43.7% |
Demographics Similar to Immigrants from Bolivia by Currently Married
In terms of currently married, the demographic groups most similar to Immigrants from Bolivia are American (48.0%, a difference of 0.030%), Korean (47.9%, a difference of 0.040%), Indian (Asian) (48.0%, a difference of 0.050%), Lebanese (47.9%, a difference of 0.090%), and Native Hawaiian (47.9%, a difference of 0.11%).
| Demographics | Rating | Rank | Currently Married |
| Immigrants | Israel | 96.9 /100 | #84 | Exceptional 48.1% |
| French Canadians | 96.3 /100 | #85 | Exceptional 48.0% |
| Immigrants | Japan | 96.2 /100 | #86 | Exceptional 48.0% |
| Jordanians | 96.2 /100 | #87 | Exceptional 48.0% |
| Immigrants | Eastern Europe | 96.1 /100 | #88 | Exceptional 48.0% |
| Indians (Asian) | 95.8 /100 | #89 | Exceptional 48.0% |
| Americans | 95.7 /100 | #90 | Exceptional 48.0% |
| Immigrants | Bolivia | 95.6 /100 | #91 | Exceptional 47.9% |
| Koreans | 95.4 /100 | #92 | Exceptional 47.9% |
| Lebanese | 95.1 /100 | #93 | Exceptional 47.9% |
| Native Hawaiians | 95.0 /100 | #94 | Exceptional 47.9% |
| Immigrants | Bulgaria | 94.8 /100 | #95 | Exceptional 47.9% |
| Egyptians | 94.8 /100 | #96 | Exceptional 47.9% |
| Immigrants | Ukraine | 94.8 /100 | #97 | Exceptional 47.9% |
| Immigrants | China | 94.7 /100 | #98 | Exceptional 47.9% |