Czechoslovakian vs Croatian Divorced or Separated
COMPARE
Czechoslovakian
Croatian
Divorced or Separated
Divorced or Separated Comparison
Czechoslovakians
Croatians
12.3%
DIVORCED OR SEPARATED
11.7/ 100
METRIC RATING
219th/ 347
METRIC RANK
11.9%
DIVORCED OR SEPARATED
80.6/ 100
METRIC RATING
145th/ 347
METRIC RANK
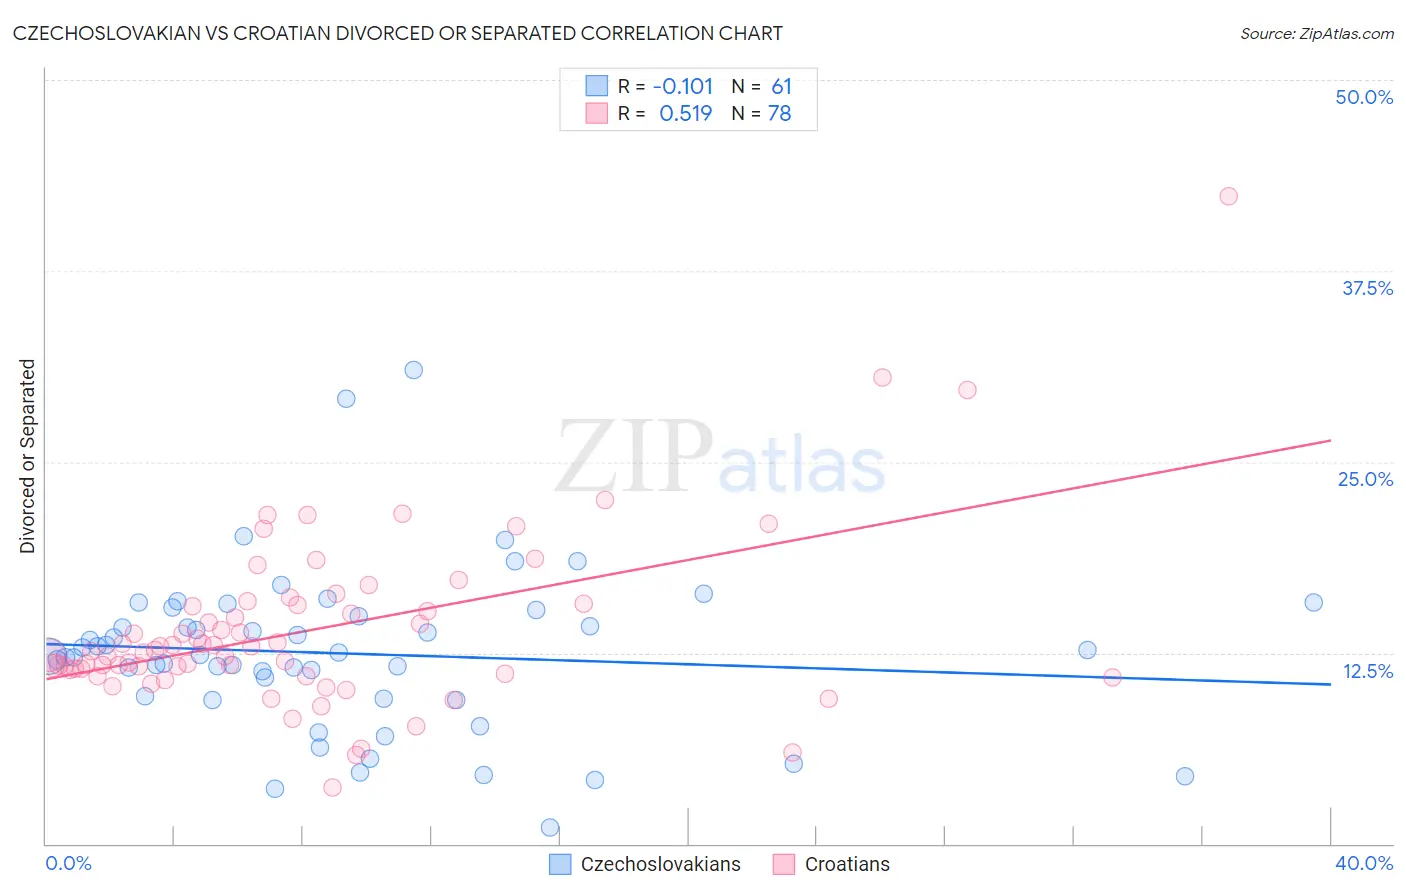
Czechoslovakian vs Croatian Divorced or Separated Correlation Chart
The statistical analysis conducted on geographies consisting of 368,586,900 people shows a poor negative correlation between the proportion of Czechoslovakians and percentage of population currently divorced or separated in the United States with a correlation coefficient (R) of -0.101 and weighted average of 12.3%. Similarly, the statistical analysis conducted on geographies consisting of 375,586,631 people shows a substantial positive correlation between the proportion of Croatians and percentage of population currently divorced or separated in the United States with a correlation coefficient (R) of 0.519 and weighted average of 11.9%, a difference of 3.0%.
Divorced or Separated Correlation Summary
| Measurement | Czechoslovakian | Croatian |
| Minimum | 1.1% | 3.7% |
| Maximum | 31.0% | 42.4% |
| Range | 29.9% | 38.7% |
| Mean | 12.5% | 14.0% |
| Median | 12.4% | 12.6% |
| Interquartile 25% (IQ1) | 9.6% | 11.4% |
| Interquartile 75% (IQ3) | 15.1% | 15.6% |
| Interquartile Range (IQR) | 5.5% | 4.2% |
| Standard Deviation (Sample) | 5.3% | 5.7% |
| Standard Deviation (Population) | 5.2% | 5.6% |
Similar Demographics by Divorced or Separated
Demographics Similar to Czechoslovakians by Divorced or Separated
In terms of divorced or separated, the demographic groups most similar to Czechoslovakians are British (12.3%, a difference of 0.010%), Guamanian/Chamorro (12.3%, a difference of 0.030%), Slovene (12.3%, a difference of 0.11%), Bangladeshi (12.3%, a difference of 0.11%), and Scandinavian (12.3%, a difference of 0.11%).
| Demographics | Rating | Rank | Divorced or Separated |
| Immigrants | Kenya | 16.5 /100 | #212 | Poor 12.2% |
| Immigrants | Eastern Africa | 16.2 /100 | #213 | Poor 12.2% |
| Immigrants | Argentina | 15.5 /100 | #214 | Poor 12.2% |
| Europeans | 15.4 /100 | #215 | Poor 12.2% |
| Immigrants | South America | 15.4 /100 | #216 | Poor 12.2% |
| Northern Europeans | 14.7 /100 | #217 | Poor 12.2% |
| Slovenes | 13.2 /100 | #218 | Poor 12.3% |
| Czechoslovakians | 11.7 /100 | #219 | Poor 12.3% |
| British | 11.6 /100 | #220 | Poor 12.3% |
| Guamanians/Chamorros | 11.3 /100 | #221 | Poor 12.3% |
| Bangladeshis | 10.5 /100 | #222 | Poor 12.3% |
| Scandinavians | 10.4 /100 | #223 | Poor 12.3% |
| Immigrants | Azores | 9.7 /100 | #224 | Tragic 12.3% |
| Belgians | 9.7 /100 | #225 | Tragic 12.3% |
| Immigrants | Western Africa | 9.3 /100 | #226 | Tragic 12.3% |
Demographics Similar to Croatians by Divorced or Separated
In terms of divorced or separated, the demographic groups most similar to Croatians are Peruvian (11.9%, a difference of 0.020%), Immigrants from Zimbabwe (11.9%, a difference of 0.050%), Pakistani (11.9%, a difference of 0.050%), Immigrants from Grenada (11.9%, a difference of 0.080%), and Polish (11.9%, a difference of 0.11%).
| Demographics | Rating | Rank | Divorced or Separated |
| Immigrants | Netherlands | 83.9 /100 | #138 | Excellent 11.9% |
| Australians | 83.6 /100 | #139 | Excellent 11.9% |
| Lebanese | 83.4 /100 | #140 | Excellent 11.9% |
| Immigrants | Morocco | 82.9 /100 | #141 | Excellent 11.9% |
| Immigrants | Zimbabwe | 81.5 /100 | #142 | Excellent 11.9% |
| Pakistanis | 81.3 /100 | #143 | Excellent 11.9% |
| Peruvians | 80.9 /100 | #144 | Excellent 11.9% |
| Croatians | 80.6 /100 | #145 | Excellent 11.9% |
| Immigrants | Grenada | 79.1 /100 | #146 | Good 11.9% |
| Poles | 78.6 /100 | #147 | Good 11.9% |
| Italians | 77.8 /100 | #148 | Good 11.9% |
| Immigrants | Oceania | 77.7 /100 | #149 | Good 11.9% |
| Immigrants | Portugal | 77.3 /100 | #150 | Good 11.9% |
| Czechs | 76.4 /100 | #151 | Good 11.9% |
| Immigrants | Hungary | 73.7 /100 | #152 | Good 11.9% |