Czechoslovakian vs Panamanian Divorced or Separated
COMPARE
Czechoslovakian
Panamanian
Divorced or Separated
Divorced or Separated Comparison
Czechoslovakians
Panamanians
12.3%
DIVORCED OR SEPARATED
11.7/ 100
METRIC RATING
219th/ 347
METRIC RANK
12.7%
DIVORCED OR SEPARATED
0.3/ 100
METRIC RATING
271st/ 347
METRIC RANK
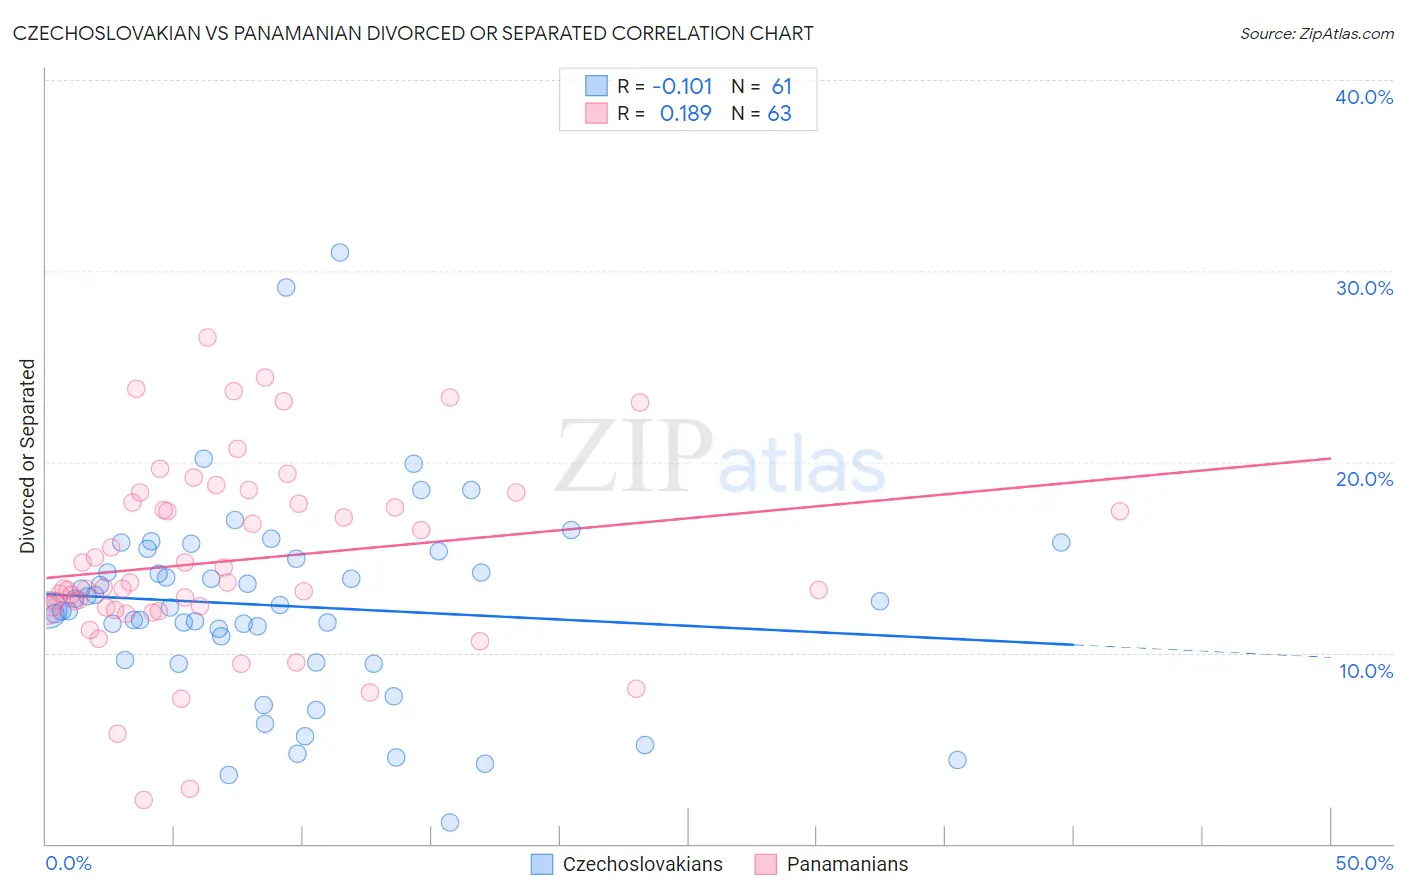
Czechoslovakian vs Panamanian Divorced or Separated Correlation Chart
The statistical analysis conducted on geographies consisting of 368,586,900 people shows a poor negative correlation between the proportion of Czechoslovakians and percentage of population currently divorced or separated in the United States with a correlation coefficient (R) of -0.101 and weighted average of 12.3%. Similarly, the statistical analysis conducted on geographies consisting of 281,170,767 people shows a poor positive correlation between the proportion of Panamanians and percentage of population currently divorced or separated in the United States with a correlation coefficient (R) of 0.189 and weighted average of 12.7%, a difference of 3.1%.
Divorced or Separated Correlation Summary
| Measurement | Czechoslovakian | Panamanian |
| Minimum | 1.1% | 2.3% |
| Maximum | 31.0% | 26.5% |
| Range | 29.9% | 24.2% |
| Mean | 12.5% | 14.8% |
| Median | 12.4% | 13.4% |
| Interquartile 25% (IQ1) | 9.6% | 12.3% |
| Interquartile 75% (IQ3) | 15.1% | 17.9% |
| Interquartile Range (IQR) | 5.5% | 5.6% |
| Standard Deviation (Sample) | 5.3% | 5.0% |
| Standard Deviation (Population) | 5.2% | 4.9% |
Similar Demographics by Divorced or Separated
Demographics Similar to Czechoslovakians by Divorced or Separated
In terms of divorced or separated, the demographic groups most similar to Czechoslovakians are British (12.3%, a difference of 0.010%), Guamanian/Chamorro (12.3%, a difference of 0.030%), Slovene (12.3%, a difference of 0.11%), Bangladeshi (12.3%, a difference of 0.11%), and Scandinavian (12.3%, a difference of 0.11%).
| Demographics | Rating | Rank | Divorced or Separated |
| Immigrants | Kenya | 16.5 /100 | #212 | Poor 12.2% |
| Immigrants | Eastern Africa | 16.2 /100 | #213 | Poor 12.2% |
| Immigrants | Argentina | 15.5 /100 | #214 | Poor 12.2% |
| Europeans | 15.4 /100 | #215 | Poor 12.2% |
| Immigrants | South America | 15.4 /100 | #216 | Poor 12.2% |
| Northern Europeans | 14.7 /100 | #217 | Poor 12.2% |
| Slovenes | 13.2 /100 | #218 | Poor 12.3% |
| Czechoslovakians | 11.7 /100 | #219 | Poor 12.3% |
| British | 11.6 /100 | #220 | Poor 12.3% |
| Guamanians/Chamorros | 11.3 /100 | #221 | Poor 12.3% |
| Bangladeshis | 10.5 /100 | #222 | Poor 12.3% |
| Scandinavians | 10.4 /100 | #223 | Poor 12.3% |
| Immigrants | Azores | 9.7 /100 | #224 | Tragic 12.3% |
| Belgians | 9.7 /100 | #225 | Tragic 12.3% |
| Immigrants | Western Africa | 9.3 /100 | #226 | Tragic 12.3% |
Demographics Similar to Panamanians by Divorced or Separated
In terms of divorced or separated, the demographic groups most similar to Panamanians are Immigrants from Middle Africa (12.7%, a difference of 0.050%), Ute (12.6%, a difference of 0.060%), Immigrants from Micronesia (12.7%, a difference of 0.16%), Immigrants from Liberia (12.6%, a difference of 0.18%), and Bermudan (12.7%, a difference of 0.18%).
| Demographics | Rating | Rank | Divorced or Separated |
| English | 0.5 /100 | #264 | Tragic 12.6% |
| Immigrants | Senegal | 0.5 /100 | #265 | Tragic 12.6% |
| Whites/Caucasians | 0.5 /100 | #266 | Tragic 12.6% |
| Scottish | 0.4 /100 | #267 | Tragic 12.6% |
| Fijians | 0.4 /100 | #268 | Tragic 12.6% |
| Immigrants | Liberia | 0.4 /100 | #269 | Tragic 12.6% |
| Ute | 0.4 /100 | #270 | Tragic 12.6% |
| Panamanians | 0.3 /100 | #271 | Tragic 12.7% |
| Immigrants | Middle Africa | 0.3 /100 | #272 | Tragic 12.7% |
| Immigrants | Micronesia | 0.3 /100 | #273 | Tragic 12.7% |
| Bermudans | 0.3 /100 | #274 | Tragic 12.7% |
| Central American Indians | 0.3 /100 | #275 | Tragic 12.7% |
| Spaniards | 0.2 /100 | #276 | Tragic 12.7% |
| Dominicans | 0.2 /100 | #277 | Tragic 12.7% |
| Lumbee | 0.2 /100 | #278 | Tragic 12.7% |