Immigrants from Cambodia vs Croatian Divorced or Separated
COMPARE
Immigrants from Cambodia
Croatian
Divorced or Separated
Divorced or Separated Comparison
Immigrants from Cambodia
Croatians
11.8%
DIVORCED OR SEPARATED
88.2/ 100
METRIC RATING
131st/ 347
METRIC RANK
11.9%
DIVORCED OR SEPARATED
80.6/ 100
METRIC RATING
145th/ 347
METRIC RANK
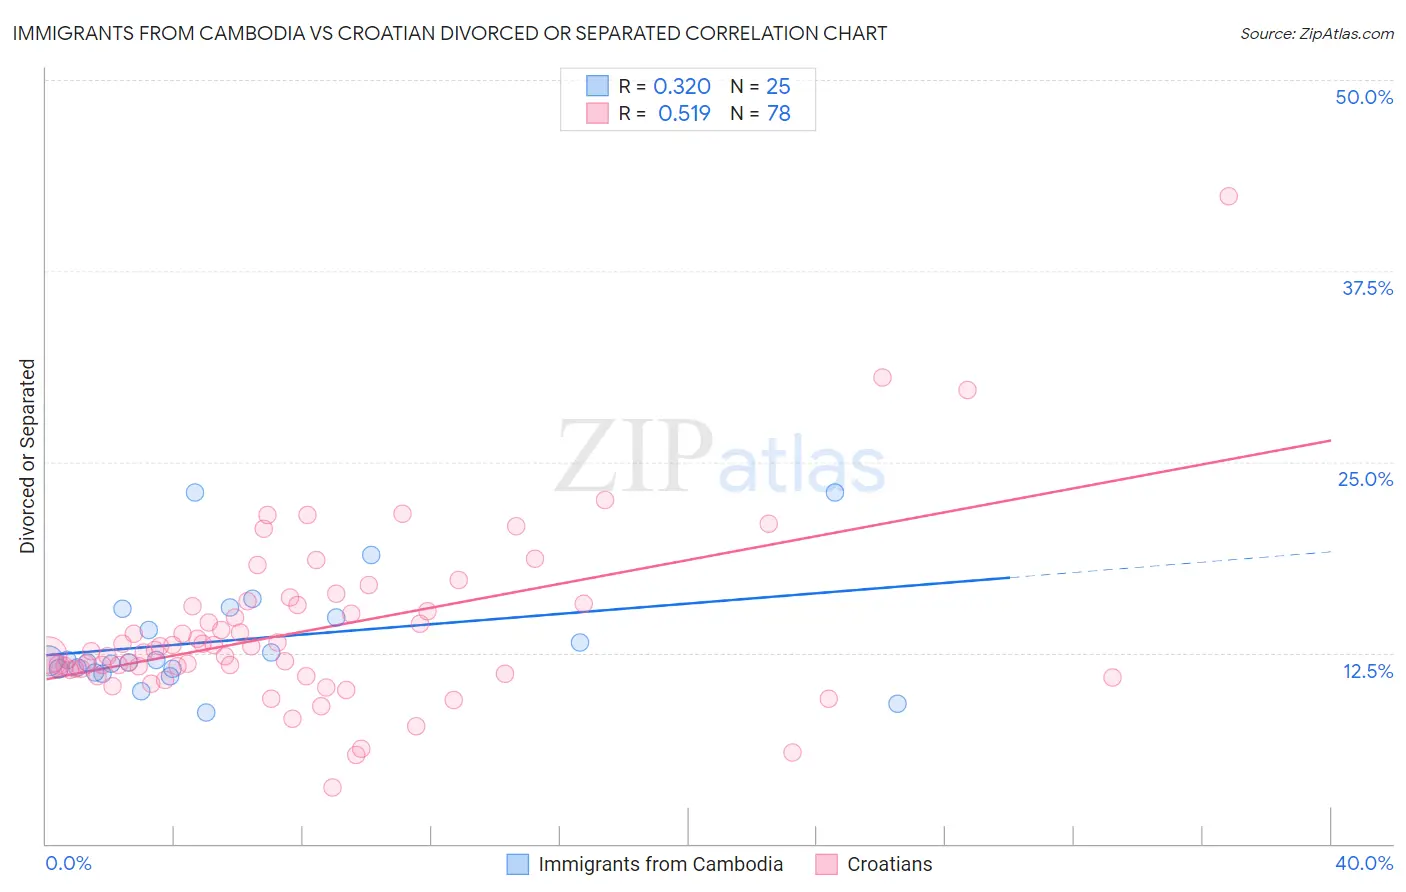
Immigrants from Cambodia vs Croatian Divorced or Separated Correlation Chart
The statistical analysis conducted on geographies consisting of 205,150,019 people shows a mild positive correlation between the proportion of Immigrants from Cambodia and percentage of population currently divorced or separated in the United States with a correlation coefficient (R) of 0.320 and weighted average of 11.8%. Similarly, the statistical analysis conducted on geographies consisting of 375,586,631 people shows a substantial positive correlation between the proportion of Croatians and percentage of population currently divorced or separated in the United States with a correlation coefficient (R) of 0.519 and weighted average of 11.9%, a difference of 0.52%.
Divorced or Separated Correlation Summary
| Measurement | Immigrants from Cambodia | Croatian |
| Minimum | 8.6% | 3.7% |
| Maximum | 23.0% | 42.4% |
| Range | 14.4% | 38.7% |
| Mean | 13.3% | 14.0% |
| Median | 12.0% | 12.6% |
| Interquartile 25% (IQ1) | 11.3% | 11.4% |
| Interquartile 75% (IQ3) | 15.1% | 15.6% |
| Interquartile Range (IQR) | 3.7% | 4.2% |
| Standard Deviation (Sample) | 3.7% | 5.7% |
| Standard Deviation (Population) | 3.6% | 5.6% |
Demographics Similar to Immigrants from Cambodia and Croatians by Divorced or Separated
In terms of divorced or separated, the demographic groups most similar to Immigrants from Cambodia are Immigrants from Austria (11.8%, a difference of 0.0%), Immigrants from St. Vincent and the Grenadines (11.8%, a difference of 0.020%), Immigrants from Afghanistan (11.8%, a difference of 0.030%), Immigrants from Ecuador (11.8%, a difference of 0.060%), and New Zealander (11.9%, a difference of 0.060%). Similarly, the demographic groups most similar to Croatians are Peruvian (11.9%, a difference of 0.020%), Immigrants from Zimbabwe (11.9%, a difference of 0.050%), Pakistani (11.9%, a difference of 0.050%), Immigrants from Grenada (11.9%, a difference of 0.080%), and Polish (11.9%, a difference of 0.11%).
| Demographics | Rating | Rank | Divorced or Separated |
| Immigrants | Ecuador | 88.9 /100 | #128 | Excellent 11.8% |
| Immigrants | St. Vincent and the Grenadines | 88.4 /100 | #129 | Excellent 11.8% |
| Immigrants | Austria | 88.2 /100 | #130 | Excellent 11.8% |
| Immigrants | Cambodia | 88.2 /100 | #131 | Excellent 11.8% |
| Immigrants | Afghanistan | 87.9 /100 | #132 | Excellent 11.8% |
| New Zealanders | 87.5 /100 | #133 | Excellent 11.9% |
| Argentineans | 85.1 /100 | #134 | Excellent 11.9% |
| Danes | 84.8 /100 | #135 | Excellent 11.9% |
| Carpatho Rusyns | 84.8 /100 | #136 | Excellent 11.9% |
| Alsatians | 84.0 /100 | #137 | Excellent 11.9% |
| Immigrants | Netherlands | 83.9 /100 | #138 | Excellent 11.9% |
| Australians | 83.6 /100 | #139 | Excellent 11.9% |
| Lebanese | 83.4 /100 | #140 | Excellent 11.9% |
| Immigrants | Morocco | 82.9 /100 | #141 | Excellent 11.9% |
| Immigrants | Zimbabwe | 81.5 /100 | #142 | Excellent 11.9% |
| Pakistanis | 81.3 /100 | #143 | Excellent 11.9% |
| Peruvians | 80.9 /100 | #144 | Excellent 11.9% |
| Croatians | 80.6 /100 | #145 | Excellent 11.9% |
| Immigrants | Grenada | 79.1 /100 | #146 | Good 11.9% |
| Poles | 78.6 /100 | #147 | Good 11.9% |
| Italians | 77.8 /100 | #148 | Good 11.9% |