Potawatomi vs Croatian Divorced or Separated
COMPARE
Potawatomi
Croatian
Divorced or Separated
Divorced or Separated Comparison
Potawatomi
Croatians
13.5%
DIVORCED OR SEPARATED
0.0/ 100
METRIC RATING
325th/ 347
METRIC RANK
11.9%
DIVORCED OR SEPARATED
80.6/ 100
METRIC RATING
145th/ 347
METRIC RANK
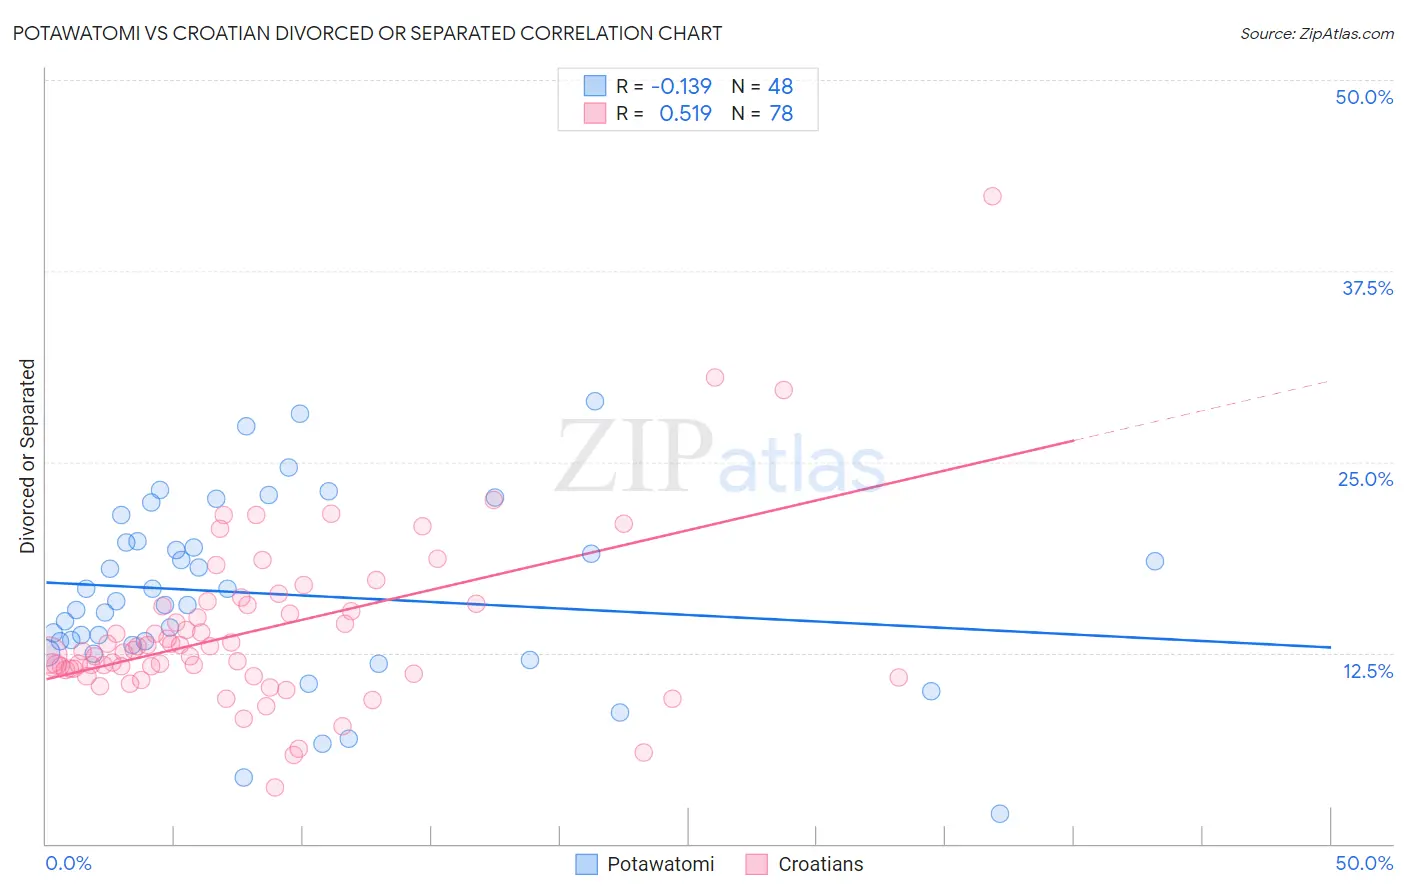
Potawatomi vs Croatian Divorced or Separated Correlation Chart
The statistical analysis conducted on geographies consisting of 117,768,294 people shows a poor negative correlation between the proportion of Potawatomi and percentage of population currently divorced or separated in the United States with a correlation coefficient (R) of -0.139 and weighted average of 13.5%. Similarly, the statistical analysis conducted on geographies consisting of 375,586,631 people shows a substantial positive correlation between the proportion of Croatians and percentage of population currently divorced or separated in the United States with a correlation coefficient (R) of 0.519 and weighted average of 11.9%, a difference of 13.0%.
Divorced or Separated Correlation Summary
| Measurement | Potawatomi | Croatian |
| Minimum | 2.0% | 3.7% |
| Maximum | 29.0% | 42.4% |
| Range | 27.0% | 38.7% |
| Mean | 16.4% | 14.0% |
| Median | 15.7% | 12.6% |
| Interquartile 25% (IQ1) | 13.1% | 11.4% |
| Interquartile 75% (IQ3) | 19.7% | 15.6% |
| Interquartile Range (IQR) | 6.6% | 4.2% |
| Standard Deviation (Sample) | 5.9% | 5.7% |
| Standard Deviation (Population) | 5.8% | 5.6% |
Similar Demographics by Divorced or Separated
Demographics Similar to Potawatomi by Divorced or Separated
In terms of divorced or separated, the demographic groups most similar to Potawatomi are Immigrants from Congo (13.5%, a difference of 0.010%), Osage (13.4%, a difference of 0.060%), U.S. Virgin Islander (13.4%, a difference of 0.13%), Immigrants from Haiti (13.4%, a difference of 0.35%), and Comanche (13.5%, a difference of 0.49%).
| Demographics | Rating | Rank | Divorced or Separated |
| Cree | 0.0 /100 | #318 | Tragic 13.4% |
| Puget Sound Salish | 0.0 /100 | #319 | Tragic 13.4% |
| Cajuns | 0.0 /100 | #320 | Tragic 13.4% |
| Cheyenne | 0.0 /100 | #321 | Tragic 13.4% |
| Immigrants | Haiti | 0.0 /100 | #322 | Tragic 13.4% |
| U.S. Virgin Islanders | 0.0 /100 | #323 | Tragic 13.4% |
| Osage | 0.0 /100 | #324 | Tragic 13.4% |
| Potawatomi | 0.0 /100 | #325 | Tragic 13.5% |
| Immigrants | Congo | 0.0 /100 | #326 | Tragic 13.5% |
| Comanche | 0.0 /100 | #327 | Tragic 13.5% |
| Immigrants | Caribbean | 0.0 /100 | #328 | Tragic 13.6% |
| Houma | 0.0 /100 | #329 | Tragic 13.6% |
| Paiute | 0.0 /100 | #330 | Tragic 13.6% |
| Blacks/African Americans | 0.0 /100 | #331 | Tragic 13.6% |
| Cherokee | 0.0 /100 | #332 | Tragic 13.7% |
Demographics Similar to Croatians by Divorced or Separated
In terms of divorced or separated, the demographic groups most similar to Croatians are Peruvian (11.9%, a difference of 0.020%), Immigrants from Zimbabwe (11.9%, a difference of 0.050%), Pakistani (11.9%, a difference of 0.050%), Immigrants from Grenada (11.9%, a difference of 0.080%), and Polish (11.9%, a difference of 0.11%).
| Demographics | Rating | Rank | Divorced or Separated |
| Immigrants | Netherlands | 83.9 /100 | #138 | Excellent 11.9% |
| Australians | 83.6 /100 | #139 | Excellent 11.9% |
| Lebanese | 83.4 /100 | #140 | Excellent 11.9% |
| Immigrants | Morocco | 82.9 /100 | #141 | Excellent 11.9% |
| Immigrants | Zimbabwe | 81.5 /100 | #142 | Excellent 11.9% |
| Pakistanis | 81.3 /100 | #143 | Excellent 11.9% |
| Peruvians | 80.9 /100 | #144 | Excellent 11.9% |
| Croatians | 80.6 /100 | #145 | Excellent 11.9% |
| Immigrants | Grenada | 79.1 /100 | #146 | Good 11.9% |
| Poles | 78.6 /100 | #147 | Good 11.9% |
| Italians | 77.8 /100 | #148 | Good 11.9% |
| Immigrants | Oceania | 77.7 /100 | #149 | Good 11.9% |
| Immigrants | Portugal | 77.3 /100 | #150 | Good 11.9% |
| Czechs | 76.4 /100 | #151 | Good 11.9% |
| Immigrants | Hungary | 73.7 /100 | #152 | Good 11.9% |