Immigrants from Zimbabwe vs Croatian Divorced or Separated
COMPARE
Immigrants from Zimbabwe
Croatian
Divorced or Separated
Divorced or Separated Comparison
Immigrants from Zimbabwe
Croatians
11.9%
DIVORCED OR SEPARATED
81.5/ 100
METRIC RATING
142nd/ 347
METRIC RANK
11.9%
DIVORCED OR SEPARATED
80.6/ 100
METRIC RATING
145th/ 347
METRIC RANK
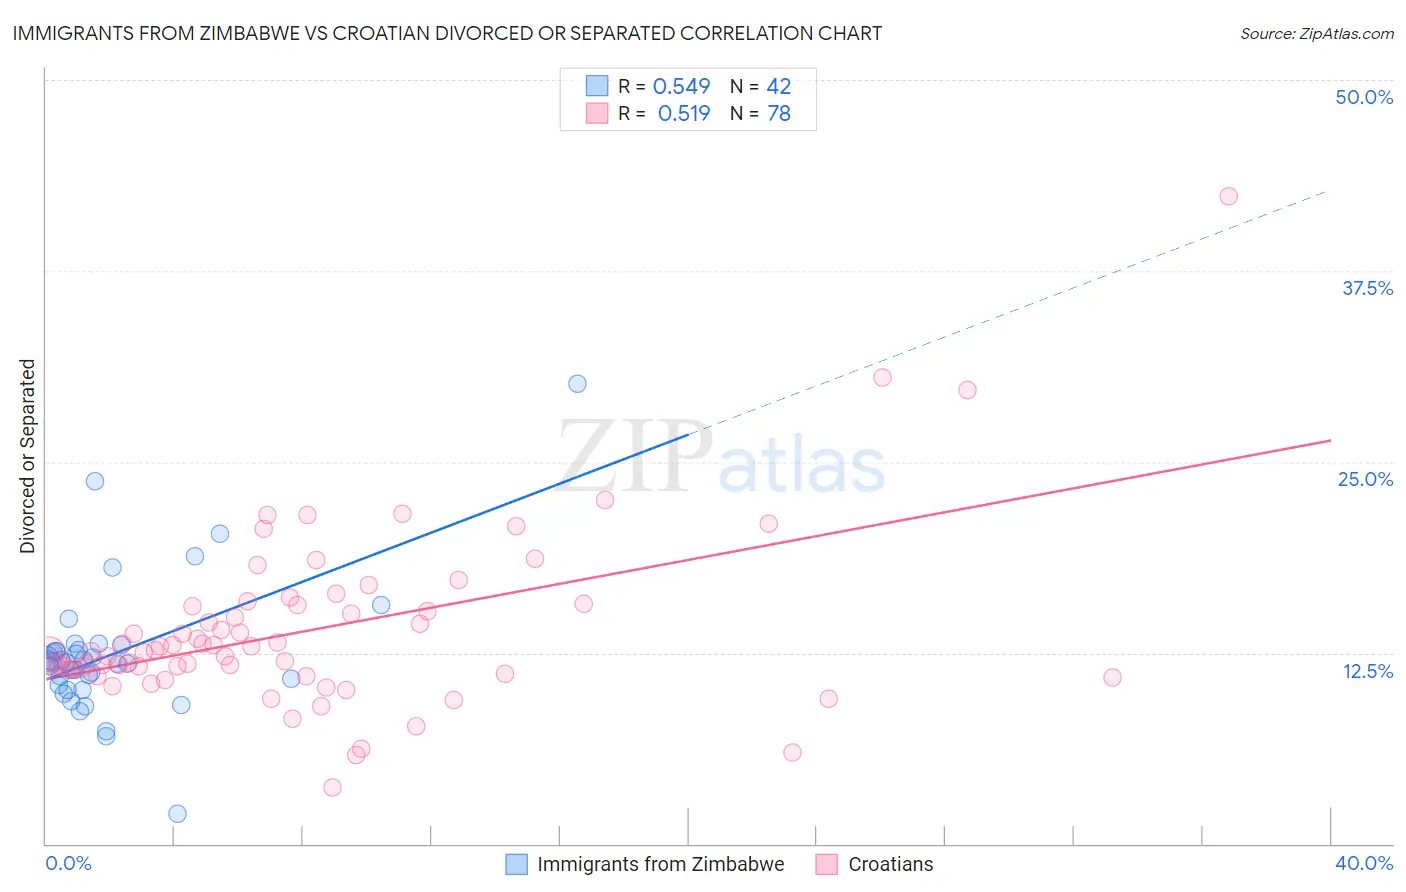
Immigrants from Zimbabwe vs Croatian Divorced or Separated Correlation Chart
The statistical analysis conducted on geographies consisting of 117,798,531 people shows a substantial positive correlation between the proportion of Immigrants from Zimbabwe and percentage of population currently divorced or separated in the United States with a correlation coefficient (R) of 0.549 and weighted average of 11.9%. Similarly, the statistical analysis conducted on geographies consisting of 375,586,631 people shows a substantial positive correlation between the proportion of Croatians and percentage of population currently divorced or separated in the United States with a correlation coefficient (R) of 0.519 and weighted average of 11.9%, a difference of 0.050%.
Divorced or Separated Correlation Summary
| Measurement | Immigrants from Zimbabwe | Croatian |
| Minimum | 2.0% | 3.7% |
| Maximum | 30.1% | 42.4% |
| Range | 28.1% | 38.7% |
| Mean | 12.4% | 14.0% |
| Median | 11.9% | 12.6% |
| Interquartile 25% (IQ1) | 10.4% | 11.4% |
| Interquartile 75% (IQ3) | 12.7% | 15.6% |
| Interquartile Range (IQR) | 2.4% | 4.2% |
| Standard Deviation (Sample) | 4.5% | 5.7% |
| Standard Deviation (Population) | 4.5% | 5.6% |
Demographics Similar to Immigrants from Zimbabwe and Croatians by Divorced or Separated
In terms of divorced or separated, the demographic groups most similar to Immigrants from Zimbabwe are Pakistani (11.9%, a difference of 0.010%), Peruvian (11.9%, a difference of 0.030%), Immigrants from Morocco (11.9%, a difference of 0.090%), Lebanese (11.9%, a difference of 0.12%), and Australian (11.9%, a difference of 0.13%). Similarly, the demographic groups most similar to Croatians are Peruvian (11.9%, a difference of 0.020%), Pakistani (11.9%, a difference of 0.050%), Immigrants from Grenada (11.9%, a difference of 0.080%), Polish (11.9%, a difference of 0.11%), and Immigrants from Morocco (11.9%, a difference of 0.14%).
| Demographics | Rating | Rank | Divorced or Separated |
| New Zealanders | 87.5 /100 | #133 | Excellent 11.9% |
| Argentineans | 85.1 /100 | #134 | Excellent 11.9% |
| Danes | 84.8 /100 | #135 | Excellent 11.9% |
| Carpatho Rusyns | 84.8 /100 | #136 | Excellent 11.9% |
| Alsatians | 84.0 /100 | #137 | Excellent 11.9% |
| Immigrants | Netherlands | 83.9 /100 | #138 | Excellent 11.9% |
| Australians | 83.6 /100 | #139 | Excellent 11.9% |
| Lebanese | 83.4 /100 | #140 | Excellent 11.9% |
| Immigrants | Morocco | 82.9 /100 | #141 | Excellent 11.9% |
| Immigrants | Zimbabwe | 81.5 /100 | #142 | Excellent 11.9% |
| Pakistanis | 81.3 /100 | #143 | Excellent 11.9% |
| Peruvians | 80.9 /100 | #144 | Excellent 11.9% |
| Croatians | 80.6 /100 | #145 | Excellent 11.9% |
| Immigrants | Grenada | 79.1 /100 | #146 | Good 11.9% |
| Poles | 78.6 /100 | #147 | Good 11.9% |
| Italians | 77.8 /100 | #148 | Good 11.9% |
| Immigrants | Oceania | 77.7 /100 | #149 | Good 11.9% |
| Immigrants | Portugal | 77.3 /100 | #150 | Good 11.9% |
| Czechs | 76.4 /100 | #151 | Good 11.9% |
| Immigrants | Hungary | 73.7 /100 | #152 | Good 11.9% |
| Austrians | 72.2 /100 | #153 | Good 12.0% |