Czechoslovakian vs Slovak Divorced or Separated
COMPARE
Czechoslovakian
Slovak
Divorced or Separated
Divorced or Separated Comparison
Czechoslovakians
Slovaks
12.3%
DIVORCED OR SEPARATED
11.7/ 100
METRIC RATING
219th/ 347
METRIC RANK
12.2%
DIVORCED OR SEPARATED
21.0/ 100
METRIC RATING
206th/ 347
METRIC RANK
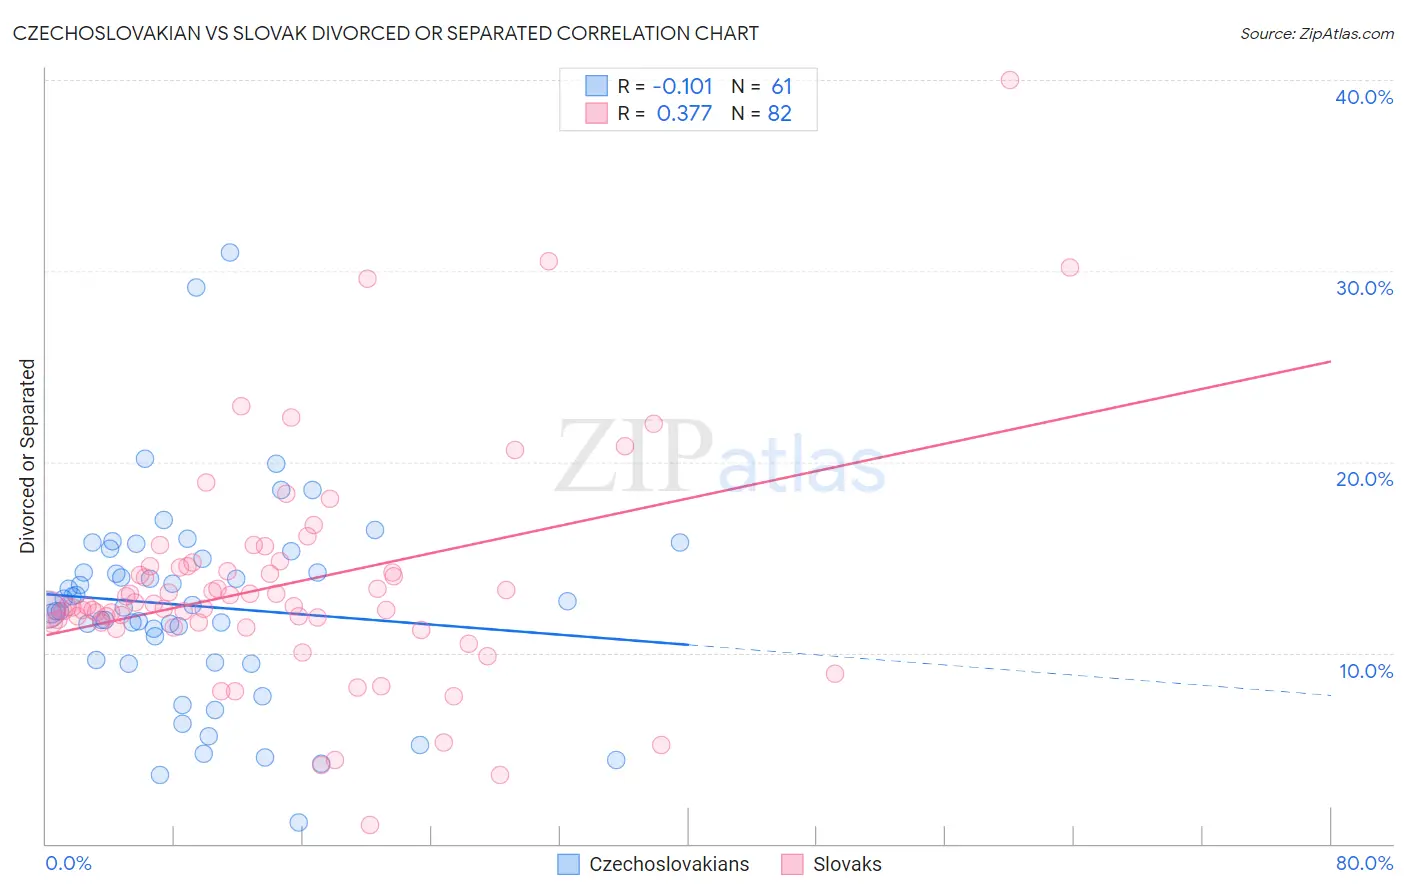
Czechoslovakian vs Slovak Divorced or Separated Correlation Chart
The statistical analysis conducted on geographies consisting of 368,586,900 people shows a poor negative correlation between the proportion of Czechoslovakians and percentage of population currently divorced or separated in the United States with a correlation coefficient (R) of -0.101 and weighted average of 12.3%. Similarly, the statistical analysis conducted on geographies consisting of 397,744,388 people shows a mild positive correlation between the proportion of Slovaks and percentage of population currently divorced or separated in the United States with a correlation coefficient (R) of 0.377 and weighted average of 12.2%, a difference of 0.60%.
Divorced or Separated Correlation Summary
| Measurement | Czechoslovakian | Slovak |
| Minimum | 1.1% | 1.0% |
| Maximum | 31.0% | 40.0% |
| Range | 29.9% | 39.0% |
| Mean | 12.5% | 13.6% |
| Median | 12.4% | 12.4% |
| Interquartile 25% (IQ1) | 9.6% | 11.6% |
| Interquartile 75% (IQ3) | 15.1% | 14.6% |
| Interquartile Range (IQR) | 5.5% | 3.0% |
| Standard Deviation (Sample) | 5.3% | 5.9% |
| Standard Deviation (Population) | 5.2% | 5.9% |
Demographics Similar to Czechoslovakians and Slovaks by Divorced or Separated
In terms of divorced or separated, the demographic groups most similar to Czechoslovakians are British (12.3%, a difference of 0.010%), Guamanian/Chamorro (12.3%, a difference of 0.030%), Slovene (12.3%, a difference of 0.11%), Bangladeshi (12.3%, a difference of 0.11%), and Northern European (12.2%, a difference of 0.22%). Similarly, the demographic groups most similar to Slovaks are Mexican (12.2%, a difference of 0.0%), Immigrants from Costa Rica (12.2%, a difference of 0.010%), Kenyan (12.2%, a difference of 0.040%), Immigrants from Guatemala (12.2%, a difference of 0.11%), and Portuguese (12.2%, a difference of 0.12%).
| Demographics | Rating | Rank | Divorced or Separated |
| Portuguese | 23.5 /100 | #202 | Fair 12.2% |
| Immigrants | Guatemala | 23.2 /100 | #203 | Fair 12.2% |
| Kenyans | 21.8 /100 | #204 | Fair 12.2% |
| Immigrants | Costa Rica | 21.3 /100 | #205 | Fair 12.2% |
| Slovaks | 21.0 /100 | #206 | Fair 12.2% |
| Mexicans | 21.0 /100 | #207 | Fair 12.2% |
| Immigrants | Ghana | 18.8 /100 | #208 | Poor 12.2% |
| Immigrants | Trinidad and Tobago | 17.8 /100 | #209 | Poor 12.2% |
| Slavs | 17.0 /100 | #210 | Poor 12.2% |
| Trinidadians and Tobagonians | 16.6 /100 | #211 | Poor 12.2% |
| Immigrants | Kenya | 16.5 /100 | #212 | Poor 12.2% |
| Immigrants | Eastern Africa | 16.2 /100 | #213 | Poor 12.2% |
| Immigrants | Argentina | 15.5 /100 | #214 | Poor 12.2% |
| Europeans | 15.4 /100 | #215 | Poor 12.2% |
| Immigrants | South America | 15.4 /100 | #216 | Poor 12.2% |
| Northern Europeans | 14.7 /100 | #217 | Poor 12.2% |
| Slovenes | 13.2 /100 | #218 | Poor 12.3% |
| Czechoslovakians | 11.7 /100 | #219 | Poor 12.3% |
| British | 11.6 /100 | #220 | Poor 12.3% |
| Guamanians/Chamorros | 11.3 /100 | #221 | Poor 12.3% |
| Bangladeshis | 10.5 /100 | #222 | Poor 12.3% |