Czechoslovakian vs Immigrants from Venezuela Divorced or Separated
COMPARE
Czechoslovakian
Immigrants from Venezuela
Divorced or Separated
Divorced or Separated Comparison
Czechoslovakians
Immigrants from Venezuela
12.3%
DIVORCED OR SEPARATED
11.7/ 100
METRIC RATING
219th/ 347
METRIC RANK
13.1%
DIVORCED OR SEPARATED
0.0/ 100
METRIC RATING
302nd/ 347
METRIC RANK
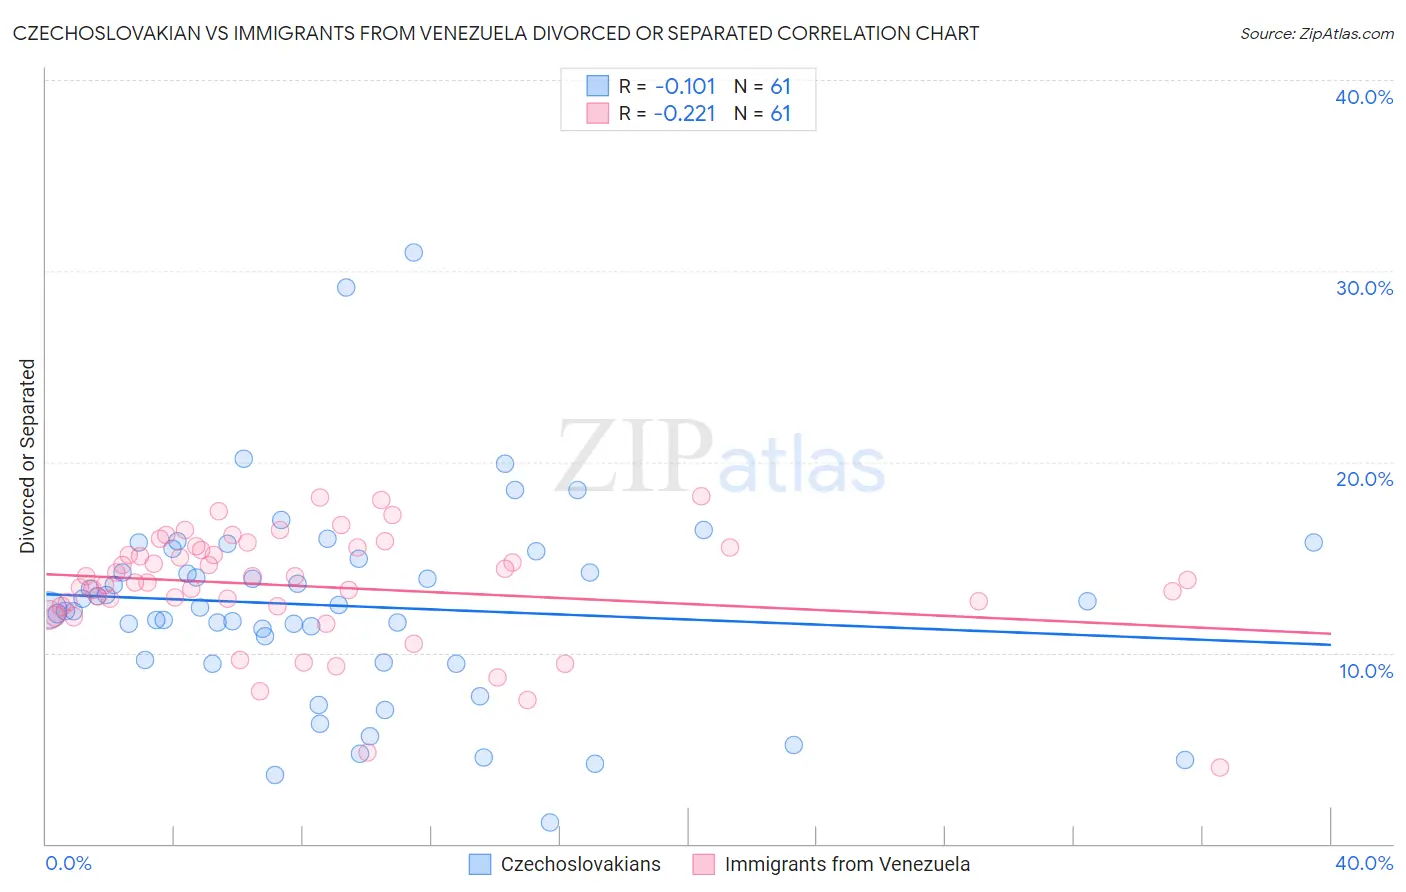
Czechoslovakian vs Immigrants from Venezuela Divorced or Separated Correlation Chart
The statistical analysis conducted on geographies consisting of 368,586,900 people shows a poor negative correlation between the proportion of Czechoslovakians and percentage of population currently divorced or separated in the United States with a correlation coefficient (R) of -0.101 and weighted average of 12.3%. Similarly, the statistical analysis conducted on geographies consisting of 287,802,999 people shows a weak negative correlation between the proportion of Immigrants from Venezuela and percentage of population currently divorced or separated in the United States with a correlation coefficient (R) of -0.221 and weighted average of 13.1%, a difference of 7.1%.
Divorced or Separated Correlation Summary
| Measurement | Czechoslovakian | Immigrants from Venezuela |
| Minimum | 1.1% | 4.0% |
| Maximum | 31.0% | 18.2% |
| Range | 29.9% | 14.2% |
| Mean | 12.5% | 13.5% |
| Median | 12.4% | 13.8% |
| Interquartile 25% (IQ1) | 9.6% | 12.4% |
| Interquartile 75% (IQ3) | 15.1% | 15.5% |
| Interquartile Range (IQR) | 5.5% | 3.1% |
| Standard Deviation (Sample) | 5.3% | 3.0% |
| Standard Deviation (Population) | 5.2% | 3.0% |
Similar Demographics by Divorced or Separated
Demographics Similar to Czechoslovakians by Divorced or Separated
In terms of divorced or separated, the demographic groups most similar to Czechoslovakians are British (12.3%, a difference of 0.010%), Guamanian/Chamorro (12.3%, a difference of 0.030%), Slovene (12.3%, a difference of 0.11%), Bangladeshi (12.3%, a difference of 0.11%), and Scandinavian (12.3%, a difference of 0.11%).
| Demographics | Rating | Rank | Divorced or Separated |
| Immigrants | Kenya | 16.5 /100 | #212 | Poor 12.2% |
| Immigrants | Eastern Africa | 16.2 /100 | #213 | Poor 12.2% |
| Immigrants | Argentina | 15.5 /100 | #214 | Poor 12.2% |
| Europeans | 15.4 /100 | #215 | Poor 12.2% |
| Immigrants | South America | 15.4 /100 | #216 | Poor 12.2% |
| Northern Europeans | 14.7 /100 | #217 | Poor 12.2% |
| Slovenes | 13.2 /100 | #218 | Poor 12.3% |
| Czechoslovakians | 11.7 /100 | #219 | Poor 12.3% |
| British | 11.6 /100 | #220 | Poor 12.3% |
| Guamanians/Chamorros | 11.3 /100 | #221 | Poor 12.3% |
| Bangladeshis | 10.5 /100 | #222 | Poor 12.3% |
| Scandinavians | 10.4 /100 | #223 | Poor 12.3% |
| Immigrants | Azores | 9.7 /100 | #224 | Tragic 12.3% |
| Belgians | 9.7 /100 | #225 | Tragic 12.3% |
| Immigrants | Western Africa | 9.3 /100 | #226 | Tragic 12.3% |
Demographics Similar to Immigrants from Venezuela by Divorced or Separated
In terms of divorced or separated, the demographic groups most similar to Immigrants from Venezuela are Cape Verdean (13.1%, a difference of 0.020%), Alaskan Athabascan (13.1%, a difference of 0.10%), Hopi (13.2%, a difference of 0.15%), Chippewa (13.2%, a difference of 0.20%), and Immigrants from Cabo Verde (13.1%, a difference of 0.31%).
| Demographics | Rating | Rank | Divorced or Separated |
| Celtics | 0.0 /100 | #295 | Tragic 13.0% |
| Nicaraguans | 0.0 /100 | #296 | Tragic 13.0% |
| Natives/Alaskans | 0.0 /100 | #297 | Tragic 13.0% |
| Venezuelans | 0.0 /100 | #298 | Tragic 13.0% |
| Immigrants | Jamaica | 0.0 /100 | #299 | Tragic 13.0% |
| Immigrants | Cabo Verde | 0.0 /100 | #300 | Tragic 13.1% |
| Alaskan Athabascans | 0.0 /100 | #301 | Tragic 13.1% |
| Immigrants | Venezuela | 0.0 /100 | #302 | Tragic 13.1% |
| Cape Verdeans | 0.0 /100 | #303 | Tragic 13.1% |
| Hopi | 0.0 /100 | #304 | Tragic 13.2% |
| Chippewa | 0.0 /100 | #305 | Tragic 13.2% |
| Tlingit-Haida | 0.0 /100 | #306 | Tragic 13.2% |
| French American Indians | 0.0 /100 | #307 | Tragic 13.2% |
| Ottawa | 0.0 /100 | #308 | Tragic 13.2% |
| Americans | 0.0 /100 | #309 | Tragic 13.2% |