Immigrants from El Salvador vs Nigerian Divorced or Separated
COMPARE
Immigrants from El Salvador
Nigerian
Divorced or Separated
Divorced or Separated Comparison
Immigrants from El Salvador
Nigerians
11.7%
DIVORCED OR SEPARATED
97.9/ 100
METRIC RATING
105th/ 347
METRIC RANK
12.1%
DIVORCED OR SEPARATED
30.1/ 100
METRIC RATING
198th/ 347
METRIC RANK
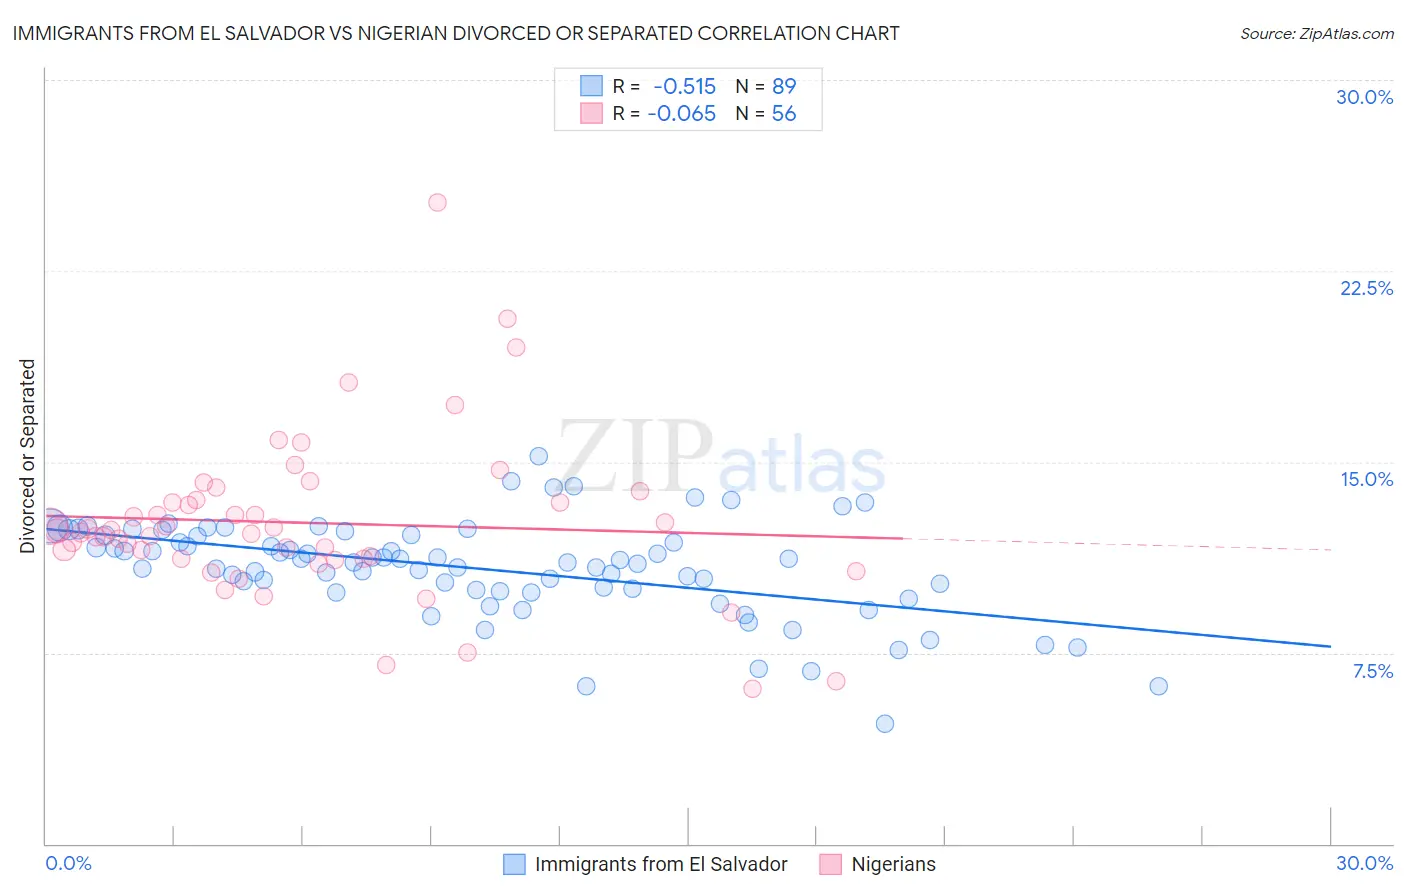
Immigrants from El Salvador vs Nigerian Divorced or Separated Correlation Chart
The statistical analysis conducted on geographies consisting of 357,792,924 people shows a substantial negative correlation between the proportion of Immigrants from El Salvador and percentage of population currently divorced or separated in the United States with a correlation coefficient (R) of -0.515 and weighted average of 11.7%. Similarly, the statistical analysis conducted on geographies consisting of 332,564,153 people shows a slight negative correlation between the proportion of Nigerians and percentage of population currently divorced or separated in the United States with a correlation coefficient (R) of -0.065 and weighted average of 12.1%, a difference of 4.2%.
Divorced or Separated Correlation Summary
| Measurement | Immigrants from El Salvador | Nigerian |
| Minimum | 4.7% | 6.1% |
| Maximum | 15.2% | 25.2% |
| Range | 10.5% | 19.1% |
| Mean | 10.8% | 12.6% |
| Median | 11.1% | 12.2% |
| Interquartile 25% (IQ1) | 9.9% | 11.2% |
| Interquartile 75% (IQ3) | 12.1% | 13.5% |
| Interquartile Range (IQR) | 2.2% | 2.3% |
| Standard Deviation (Sample) | 1.9% | 3.2% |
| Standard Deviation (Population) | 1.9% | 3.2% |
Similar Demographics by Divorced or Separated
Demographics Similar to Immigrants from El Salvador by Divorced or Separated
In terms of divorced or separated, the demographic groups most similar to Immigrants from El Salvador are Immigrants from Kazakhstan (11.7%, a difference of 0.040%), Salvadoran (11.6%, a difference of 0.12%), Maltese (11.6%, a difference of 0.14%), Immigrants from Croatia (11.6%, a difference of 0.18%), and Native Hawaiian (11.7%, a difference of 0.25%).
| Demographics | Rating | Rank | Divorced or Separated |
| Immigrants | Jordan | 98.6 /100 | #98 | Exceptional 11.6% |
| Immigrants | Sweden | 98.6 /100 | #99 | Exceptional 11.6% |
| Immigrants | Northern Europe | 98.6 /100 | #100 | Exceptional 11.6% |
| Immigrants | Guyana | 98.5 /100 | #101 | Exceptional 11.6% |
| Immigrants | Croatia | 98.3 /100 | #102 | Exceptional 11.6% |
| Maltese | 98.2 /100 | #103 | Exceptional 11.6% |
| Salvadorans | 98.2 /100 | #104 | Exceptional 11.6% |
| Immigrants | El Salvador | 97.9 /100 | #105 | Exceptional 11.7% |
| Immigrants | Kazakhstan | 97.8 /100 | #106 | Exceptional 11.7% |
| Native Hawaiians | 97.2 /100 | #107 | Exceptional 11.7% |
| Greeks | 96.9 /100 | #108 | Exceptional 11.7% |
| Immigrants | South Africa | 96.9 /100 | #109 | Exceptional 11.7% |
| Immigrants | Czechoslovakia | 96.9 /100 | #110 | Exceptional 11.7% |
| Immigrants | Spain | 96.8 /100 | #111 | Exceptional 11.7% |
| Immigrants | France | 96.6 /100 | #112 | Exceptional 11.7% |
Demographics Similar to Nigerians by Divorced or Separated
In terms of divorced or separated, the demographic groups most similar to Nigerians are Immigrants from Burma/Myanmar (12.1%, a difference of 0.010%), Immigrants from Africa (12.1%, a difference of 0.010%), Central American (12.1%, a difference of 0.030%), Immigrants from England (12.1%, a difference of 0.050%), and South American (12.2%, a difference of 0.060%).
| Demographics | Rating | Rank | Divorced or Separated |
| Swedes | 34.4 /100 | #191 | Fair 12.1% |
| Norwegians | 33.2 /100 | #192 | Fair 12.1% |
| Immigrants | Thailand | 32.5 /100 | #193 | Fair 12.1% |
| Immigrants | Eritrea | 31.9 /100 | #194 | Fair 12.1% |
| Immigrants | England | 31.4 /100 | #195 | Fair 12.1% |
| Immigrants | Burma/Myanmar | 30.4 /100 | #196 | Fair 12.1% |
| Immigrants | Africa | 30.3 /100 | #197 | Fair 12.1% |
| Nigerians | 30.1 /100 | #198 | Fair 12.1% |
| Central Americans | 29.4 /100 | #199 | Fair 12.1% |
| South Americans | 28.6 /100 | #200 | Fair 12.2% |
| Guatemalans | 26.9 /100 | #201 | Fair 12.2% |
| Portuguese | 23.5 /100 | #202 | Fair 12.2% |
| Immigrants | Guatemala | 23.2 /100 | #203 | Fair 12.2% |
| Kenyans | 21.8 /100 | #204 | Fair 12.2% |
| Immigrants | Costa Rica | 21.3 /100 | #205 | Fair 12.2% |