Northern European vs Nigerian Divorced or Separated
COMPARE
Northern European
Nigerian
Divorced or Separated
Divorced or Separated Comparison
Northern Europeans
Nigerians
12.2%
DIVORCED OR SEPARATED
14.7/ 100
METRIC RATING
217th/ 347
METRIC RANK
12.1%
DIVORCED OR SEPARATED
30.1/ 100
METRIC RATING
198th/ 347
METRIC RANK
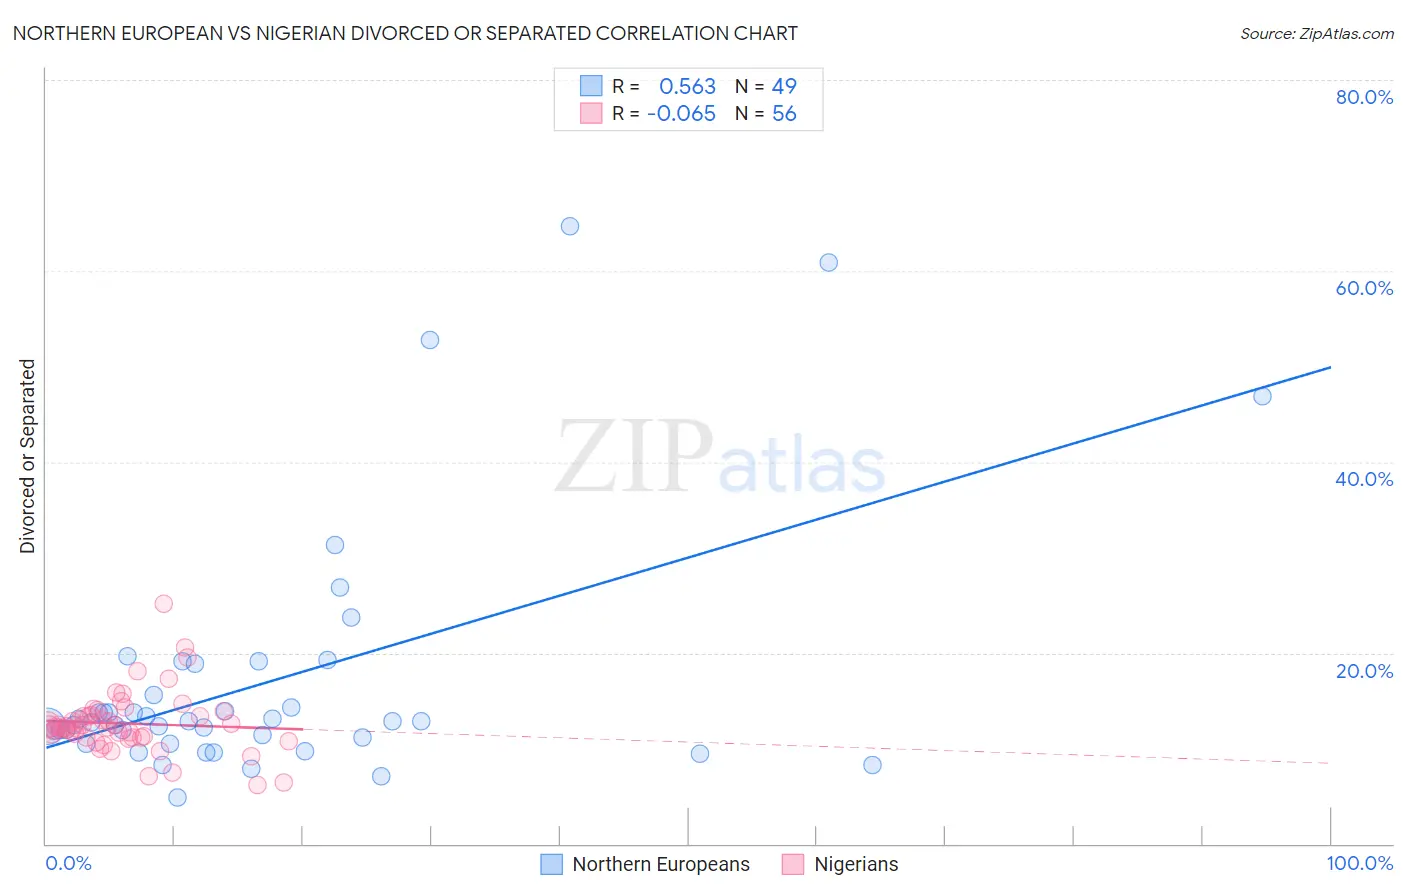
Northern European vs Nigerian Divorced or Separated Correlation Chart
The statistical analysis conducted on geographies consisting of 405,985,696 people shows a substantial positive correlation between the proportion of Northern Europeans and percentage of population currently divorced or separated in the United States with a correlation coefficient (R) of 0.563 and weighted average of 12.2%. Similarly, the statistical analysis conducted on geographies consisting of 332,564,153 people shows a slight negative correlation between the proportion of Nigerians and percentage of population currently divorced or separated in the United States with a correlation coefficient (R) of -0.065 and weighted average of 12.1%, a difference of 0.79%.
Divorced or Separated Correlation Summary
| Measurement | Northern European | Nigerian |
| Minimum | 4.9% | 6.1% |
| Maximum | 64.7% | 25.2% |
| Range | 59.8% | 19.1% |
| Mean | 16.9% | 12.6% |
| Median | 12.8% | 12.2% |
| Interquartile 25% (IQ1) | 10.8% | 11.2% |
| Interquartile 75% (IQ3) | 17.2% | 13.5% |
| Interquartile Range (IQR) | 6.4% | 2.3% |
| Standard Deviation (Sample) | 12.9% | 3.2% |
| Standard Deviation (Population) | 12.8% | 3.2% |
Demographics Similar to Northern Europeans and Nigerians by Divorced or Separated
In terms of divorced or separated, the demographic groups most similar to Northern Europeans are Immigrants from South America (12.2%, a difference of 0.040%), Immigrants from Argentina (12.2%, a difference of 0.050%), European (12.2%, a difference of 0.050%), Immigrants from Eastern Africa (12.2%, a difference of 0.10%), and Trinidadian and Tobagonian (12.2%, a difference of 0.12%). Similarly, the demographic groups most similar to Nigerians are Immigrants from Africa (12.1%, a difference of 0.010%), Central American (12.1%, a difference of 0.030%), South American (12.2%, a difference of 0.060%), Guatemalan (12.2%, a difference of 0.14%), and Portuguese (12.2%, a difference of 0.29%).
| Demographics | Rating | Rank | Divorced or Separated |
| Immigrants | Africa | 30.3 /100 | #197 | Fair 12.1% |
| Nigerians | 30.1 /100 | #198 | Fair 12.1% |
| Central Americans | 29.4 /100 | #199 | Fair 12.1% |
| South Americans | 28.6 /100 | #200 | Fair 12.2% |
| Guatemalans | 26.9 /100 | #201 | Fair 12.2% |
| Portuguese | 23.5 /100 | #202 | Fair 12.2% |
| Immigrants | Guatemala | 23.2 /100 | #203 | Fair 12.2% |
| Kenyans | 21.8 /100 | #204 | Fair 12.2% |
| Immigrants | Costa Rica | 21.3 /100 | #205 | Fair 12.2% |
| Slovaks | 21.0 /100 | #206 | Fair 12.2% |
| Mexicans | 21.0 /100 | #207 | Fair 12.2% |
| Immigrants | Ghana | 18.8 /100 | #208 | Poor 12.2% |
| Immigrants | Trinidad and Tobago | 17.8 /100 | #209 | Poor 12.2% |
| Slavs | 17.0 /100 | #210 | Poor 12.2% |
| Trinidadians and Tobagonians | 16.6 /100 | #211 | Poor 12.2% |
| Immigrants | Kenya | 16.5 /100 | #212 | Poor 12.2% |
| Immigrants | Eastern Africa | 16.2 /100 | #213 | Poor 12.2% |
| Immigrants | Argentina | 15.5 /100 | #214 | Poor 12.2% |
| Europeans | 15.4 /100 | #215 | Poor 12.2% |
| Immigrants | South America | 15.4 /100 | #216 | Poor 12.2% |
| Northern Europeans | 14.7 /100 | #217 | Poor 12.2% |