Tsimshian vs Nigerian Divorced or Separated
COMPARE
Tsimshian
Nigerian
Divorced or Separated
Divorced or Separated Comparison
Tsimshian
Nigerians
13.3%
DIVORCED OR SEPARATED
0.0/ 100
METRIC RATING
316th/ 347
METRIC RANK
12.1%
DIVORCED OR SEPARATED
30.1/ 100
METRIC RATING
198th/ 347
METRIC RANK
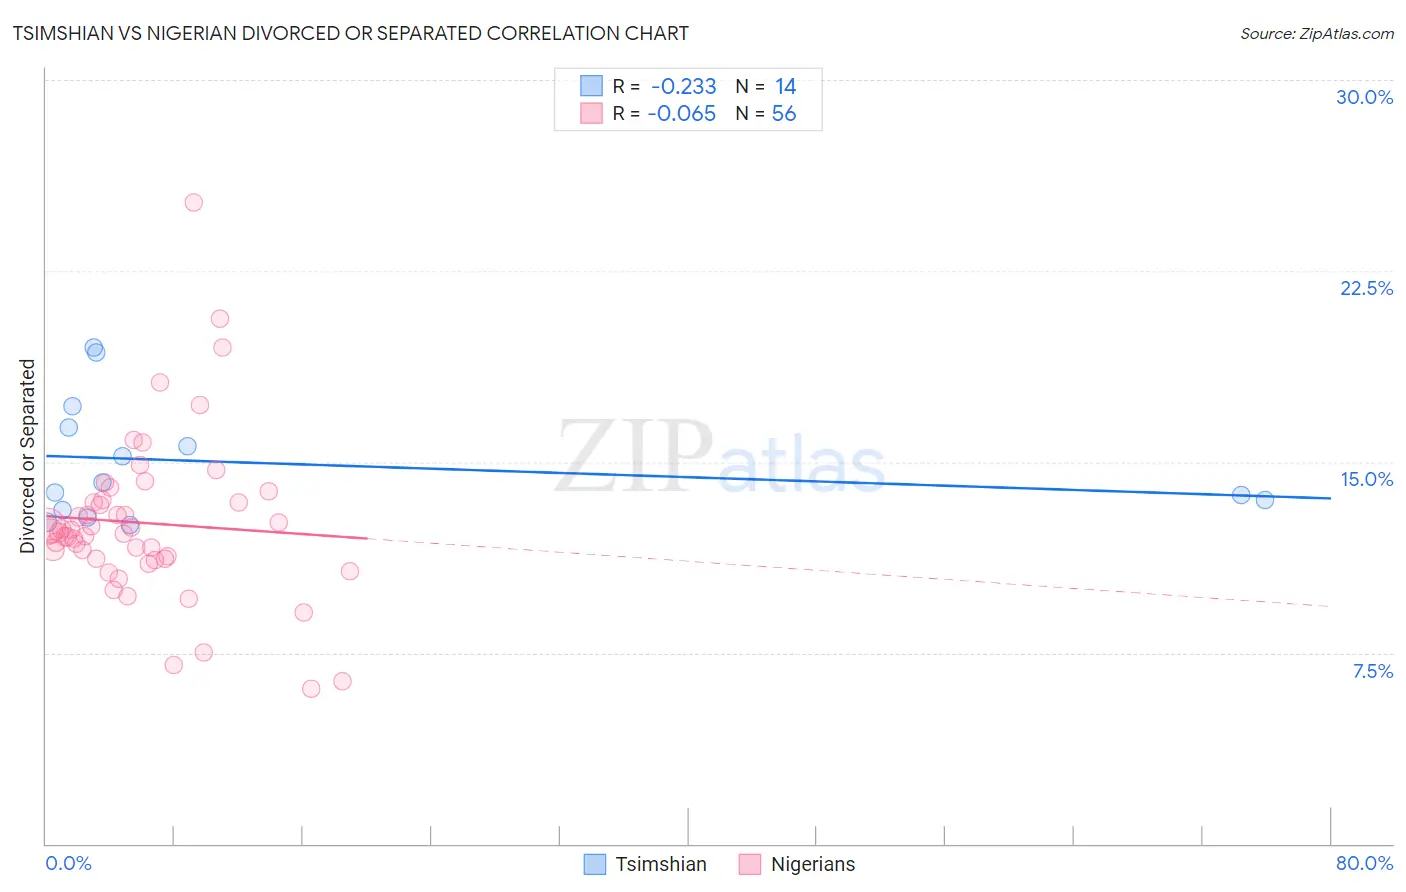
Tsimshian vs Nigerian Divorced or Separated Correlation Chart
The statistical analysis conducted on geographies consisting of 15,626,183 people shows a weak negative correlation between the proportion of Tsimshian and percentage of population currently divorced or separated in the United States with a correlation coefficient (R) of -0.233 and weighted average of 13.3%. Similarly, the statistical analysis conducted on geographies consisting of 332,564,153 people shows a slight negative correlation between the proportion of Nigerians and percentage of population currently divorced or separated in the United States with a correlation coefficient (R) of -0.065 and weighted average of 12.1%, a difference of 9.9%.
Divorced or Separated Correlation Summary
| Measurement | Tsimshian | Nigerian |
| Minimum | 12.5% | 6.1% |
| Maximum | 19.5% | 25.2% |
| Range | 7.0% | 19.1% |
| Mean | 15.0% | 12.6% |
| Median | 14.0% | 12.2% |
| Interquartile 25% (IQ1) | 13.1% | 11.2% |
| Interquartile 75% (IQ3) | 16.3% | 13.5% |
| Interquartile Range (IQR) | 3.2% | 2.3% |
| Standard Deviation (Sample) | 2.4% | 3.2% |
| Standard Deviation (Population) | 2.3% | 3.2% |
Similar Demographics by Divorced or Separated
Demographics Similar to Tsimshian by Divorced or Separated
In terms of divorced or separated, the demographic groups most similar to Tsimshian are Haitian (13.3%, a difference of 0.020%), Spanish American (13.3%, a difference of 0.030%), Cree (13.4%, a difference of 0.050%), Puget Sound Salish (13.4%, a difference of 0.080%), and Cajun (13.4%, a difference of 0.14%).
| Demographics | Rating | Rank | Divorced or Separated |
| Americans | 0.0 /100 | #309 | Tragic 13.2% |
| Africans | 0.0 /100 | #310 | Tragic 13.2% |
| Sioux | 0.0 /100 | #311 | Tragic 13.2% |
| Blackfeet | 0.0 /100 | #312 | Tragic 13.3% |
| Immigrants | Nicaragua | 0.0 /100 | #313 | Tragic 13.3% |
| Yaqui | 0.0 /100 | #314 | Tragic 13.3% |
| Spanish Americans | 0.0 /100 | #315 | Tragic 13.3% |
| Tsimshian | 0.0 /100 | #316 | Tragic 13.3% |
| Haitians | 0.0 /100 | #317 | Tragic 13.3% |
| Cree | 0.0 /100 | #318 | Tragic 13.4% |
| Puget Sound Salish | 0.0 /100 | #319 | Tragic 13.4% |
| Cajuns | 0.0 /100 | #320 | Tragic 13.4% |
| Cheyenne | 0.0 /100 | #321 | Tragic 13.4% |
| Immigrants | Haiti | 0.0 /100 | #322 | Tragic 13.4% |
| U.S. Virgin Islanders | 0.0 /100 | #323 | Tragic 13.4% |
Demographics Similar to Nigerians by Divorced or Separated
In terms of divorced or separated, the demographic groups most similar to Nigerians are Immigrants from Burma/Myanmar (12.1%, a difference of 0.010%), Immigrants from Africa (12.1%, a difference of 0.010%), Central American (12.1%, a difference of 0.030%), Immigrants from England (12.1%, a difference of 0.050%), and South American (12.2%, a difference of 0.060%).
| Demographics | Rating | Rank | Divorced or Separated |
| Swedes | 34.4 /100 | #191 | Fair 12.1% |
| Norwegians | 33.2 /100 | #192 | Fair 12.1% |
| Immigrants | Thailand | 32.5 /100 | #193 | Fair 12.1% |
| Immigrants | Eritrea | 31.9 /100 | #194 | Fair 12.1% |
| Immigrants | England | 31.4 /100 | #195 | Fair 12.1% |
| Immigrants | Burma/Myanmar | 30.4 /100 | #196 | Fair 12.1% |
| Immigrants | Africa | 30.3 /100 | #197 | Fair 12.1% |
| Nigerians | 30.1 /100 | #198 | Fair 12.1% |
| Central Americans | 29.4 /100 | #199 | Fair 12.1% |
| South Americans | 28.6 /100 | #200 | Fair 12.2% |
| Guatemalans | 26.9 /100 | #201 | Fair 12.2% |
| Portuguese | 23.5 /100 | #202 | Fair 12.2% |
| Immigrants | Guatemala | 23.2 /100 | #203 | Fair 12.2% |
| Kenyans | 21.8 /100 | #204 | Fair 12.2% |
| Immigrants | Costa Rica | 21.3 /100 | #205 | Fair 12.2% |