Guamanian/Chamorro vs Immigrants from Taiwan Single Mother Households
COMPARE
Guamanian/Chamorro
Immigrants from Taiwan
Single Mother Households
Single Mother Households Comparison
Guamanians/Chamorros
Immigrants from Taiwan
6.6%
SINGLE MOTHER HOUSEHOLDS
12.4/ 100
METRIC RATING
202nd/ 347
METRIC RANK
4.7%
SINGLE MOTHER HOUSEHOLDS
100.0/ 100
METRIC RATING
1st/ 347
METRIC RANK
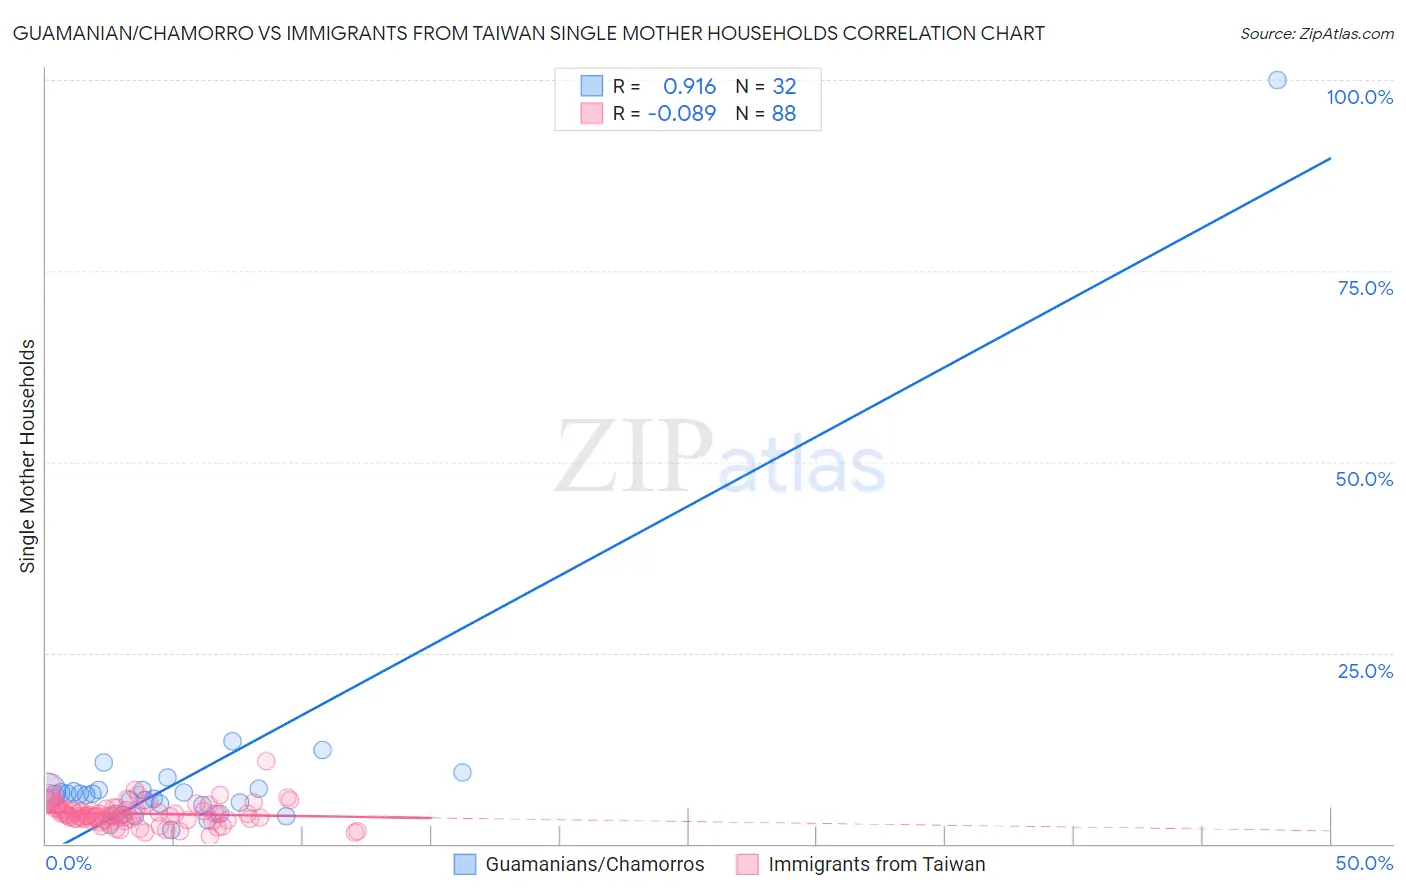
Guamanian/Chamorro vs Immigrants from Taiwan Single Mother Households Correlation Chart
The statistical analysis conducted on geographies consisting of 221,648,092 people shows a near-perfect positive correlation between the proportion of Guamanians/Chamorros and percentage of single mother households in the United States with a correlation coefficient (R) of 0.916 and weighted average of 6.6%. Similarly, the statistical analysis conducted on geographies consisting of 297,635,593 people shows a slight negative correlation between the proportion of Immigrants from Taiwan and percentage of single mother households in the United States with a correlation coefficient (R) of -0.089 and weighted average of 4.7%, a difference of 42.0%.
Single Mother Households Correlation Summary
| Measurement | Guamanian/Chamorro | Immigrants from Taiwan |
| Minimum | 1.8% | 1.0% |
| Maximum | 100.0% | 10.9% |
| Range | 98.2% | 9.8% |
| Mean | 9.2% | 3.9% |
| Median | 6.4% | 3.8% |
| Interquartile 25% (IQ1) | 4.5% | 3.2% |
| Interquartile 75% (IQ3) | 7.1% | 4.6% |
| Interquartile Range (IQR) | 2.5% | 1.4% |
| Standard Deviation (Sample) | 16.8% | 1.5% |
| Standard Deviation (Population) | 16.5% | 1.5% |
Similar Demographics by Single Mother Households
Demographics Similar to Guamanians/Chamorros by Single Mother Households
In terms of single mother households, the demographic groups most similar to Guamanians/Chamorros are Immigrants from Peru (6.7%, a difference of 0.090%), Immigrants from Fiji (6.7%, a difference of 0.11%), Venezuelan (6.6%, a difference of 0.12%), Cree (6.7%, a difference of 0.13%), and German Russian (6.7%, a difference of 0.21%).
| Demographics | Rating | Rank | Single Mother Households |
| South Americans | 18.0 /100 | #195 | Poor 6.6% |
| Uruguayans | 18.0 /100 | #196 | Poor 6.6% |
| Moroccans | 17.4 /100 | #197 | Poor 6.6% |
| Hawaiians | 16.1 /100 | #198 | Poor 6.6% |
| Potawatomi | 15.5 /100 | #199 | Poor 6.6% |
| Immigrants | Ethiopia | 14.7 /100 | #200 | Poor 6.6% |
| Venezuelans | 12.9 /100 | #201 | Poor 6.6% |
| Guamanians/Chamorros | 12.4 /100 | #202 | Poor 6.6% |
| Immigrants | Peru | 12.0 /100 | #203 | Poor 6.7% |
| Immigrants | Fiji | 11.9 /100 | #204 | Poor 6.7% |
| Cree | 11.9 /100 | #205 | Poor 6.7% |
| German Russians | 11.5 /100 | #206 | Poor 6.7% |
| Immigrants | South America | 11.5 /100 | #207 | Poor 6.7% |
| Vietnamese | 11.3 /100 | #208 | Poor 6.7% |
| Immigrants | Colombia | 10.5 /100 | #209 | Poor 6.7% |
Demographics Similar to Immigrants from Taiwan by Single Mother Households
In terms of single mother households, the demographic groups most similar to Immigrants from Taiwan are Filipino (4.7%, a difference of 0.30%), Immigrants from Iran (4.8%, a difference of 2.6%), Assyrian/Chaldean/Syriac (4.8%, a difference of 2.7%), Immigrants from Hong Kong (4.8%, a difference of 3.3%), and Immigrants from Singapore (5.0%, a difference of 5.9%).
| Demographics | Rating | Rank | Single Mother Households |
| Immigrants | Taiwan | 100.0 /100 | #1 | Exceptional 4.7% |
| Filipinos | 100.0 /100 | #2 | Exceptional 4.7% |
| Immigrants | Iran | 100.0 /100 | #3 | Exceptional 4.8% |
| Assyrians/Chaldeans/Syriacs | 100.0 /100 | #4 | Exceptional 4.8% |
| Immigrants | Hong Kong | 100.0 /100 | #5 | Exceptional 4.8% |
| Immigrants | Singapore | 100.0 /100 | #6 | Exceptional 5.0% |
| Iranians | 100.0 /100 | #7 | Exceptional 5.0% |
| Immigrants | Ireland | 99.9 /100 | #8 | Exceptional 5.0% |
| Okinawans | 99.9 /100 | #9 | Exceptional 5.0% |
| Immigrants | Israel | 99.9 /100 | #10 | Exceptional 5.0% |
| Immigrants | China | 99.9 /100 | #11 | Exceptional 5.1% |
| Cypriots | 99.9 /100 | #12 | Exceptional 5.1% |
| Immigrants | India | 99.9 /100 | #13 | Exceptional 5.1% |
| Immigrants | Australia | 99.9 /100 | #14 | Exceptional 5.1% |
| Immigrants | Eastern Asia | 99.9 /100 | #15 | Exceptional 5.1% |