Cypriot vs Syrian Single Mother Households
COMPARE
Cypriot
Syrian
Single Mother Households
Single Mother Households Comparison
Cypriots
Syrians
5.1%
SINGLE MOTHER HOUSEHOLDS
99.9/ 100
METRIC RATING
12th/ 347
METRIC RANK
6.0%
SINGLE MOTHER HOUSEHOLDS
86.0/ 100
METRIC RATING
139th/ 347
METRIC RANK
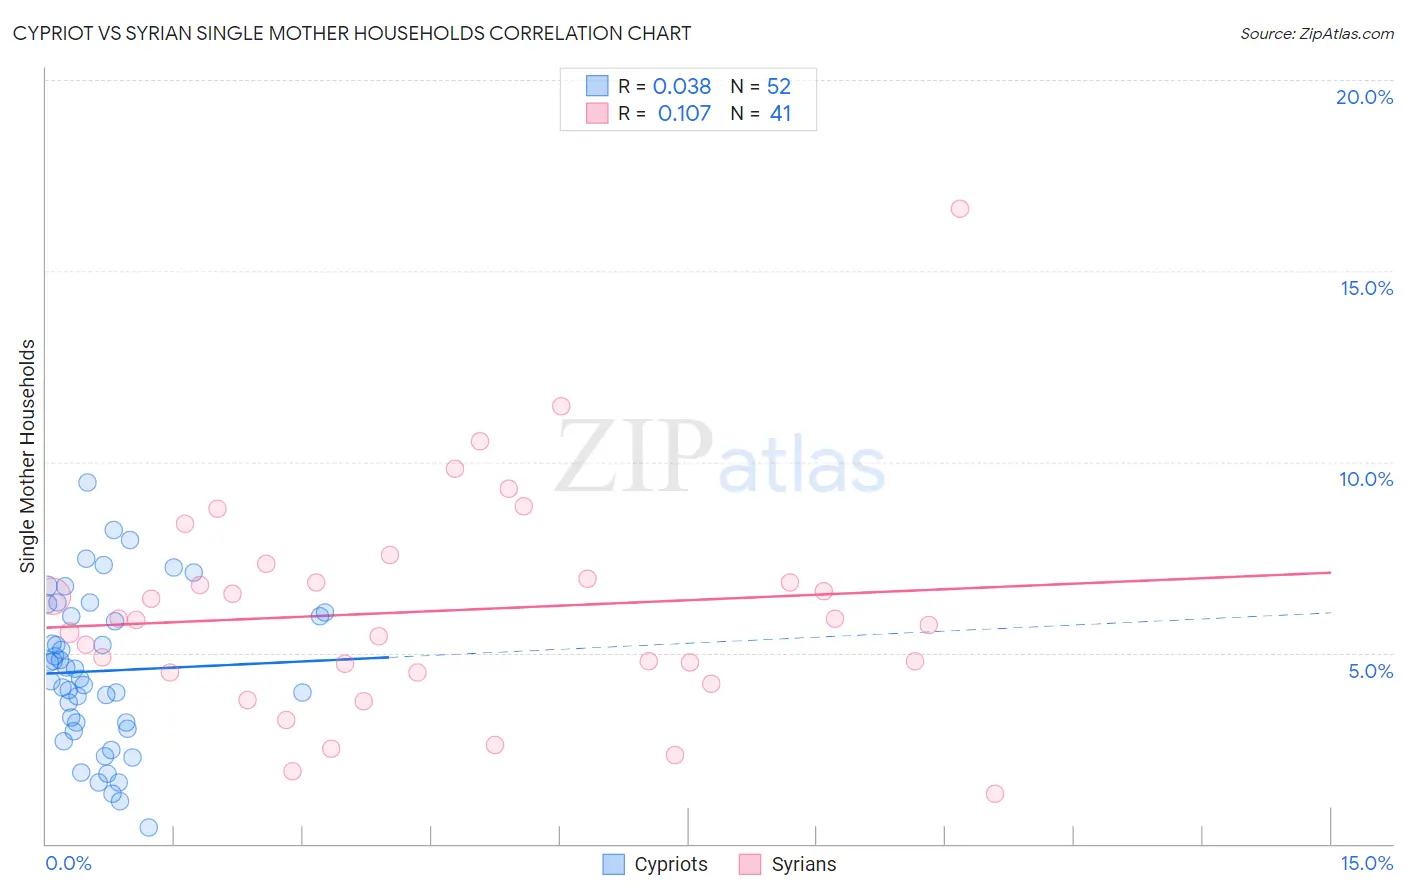
Cypriot vs Syrian Single Mother Households Correlation Chart
The statistical analysis conducted on geographies consisting of 61,798,444 people shows no correlation between the proportion of Cypriots and percentage of single mother households in the United States with a correlation coefficient (R) of 0.038 and weighted average of 5.1%. Similarly, the statistical analysis conducted on geographies consisting of 265,755,115 people shows a poor positive correlation between the proportion of Syrians and percentage of single mother households in the United States with a correlation coefficient (R) of 0.107 and weighted average of 6.0%, a difference of 18.3%.
Single Mother Households Correlation Summary
| Measurement | Cypriot | Syrian |
| Minimum | 0.41% | 1.3% |
| Maximum | 9.5% | 16.6% |
| Range | 9.0% | 15.3% |
| Mean | 4.5% | 6.1% |
| Median | 4.5% | 5.8% |
| Interquartile 25% (IQ1) | 3.1% | 4.5% |
| Interquartile 75% (IQ3) | 6.0% | 7.1% |
| Interquartile Range (IQR) | 2.9% | 2.7% |
| Standard Deviation (Sample) | 2.0% | 2.9% |
| Standard Deviation (Population) | 2.0% | 2.8% |
Similar Demographics by Single Mother Households
Demographics Similar to Cypriots by Single Mother Households
In terms of single mother households, the demographic groups most similar to Cypriots are Immigrants from India (5.1%, a difference of 0.12%), Immigrants from China (5.1%, a difference of 0.18%), Immigrants from Australia (5.1%, a difference of 0.45%), Immigrants from Eastern Asia (5.1%, a difference of 0.54%), and Indian (Asian) (5.1%, a difference of 0.73%).
| Demographics | Rating | Rank | Single Mother Households |
| Immigrants | Hong Kong | 100.0 /100 | #5 | Exceptional 4.8% |
| Immigrants | Singapore | 100.0 /100 | #6 | Exceptional 5.0% |
| Iranians | 100.0 /100 | #7 | Exceptional 5.0% |
| Immigrants | Ireland | 99.9 /100 | #8 | Exceptional 5.0% |
| Okinawans | 99.9 /100 | #9 | Exceptional 5.0% |
| Immigrants | Israel | 99.9 /100 | #10 | Exceptional 5.0% |
| Immigrants | China | 99.9 /100 | #11 | Exceptional 5.1% |
| Cypriots | 99.9 /100 | #12 | Exceptional 5.1% |
| Immigrants | India | 99.9 /100 | #13 | Exceptional 5.1% |
| Immigrants | Australia | 99.9 /100 | #14 | Exceptional 5.1% |
| Immigrants | Eastern Asia | 99.9 /100 | #15 | Exceptional 5.1% |
| Indians (Asian) | 99.9 /100 | #16 | Exceptional 5.1% |
| Soviet Union | 99.9 /100 | #17 | Exceptional 5.1% |
| Immigrants | Armenia | 99.9 /100 | #18 | Exceptional 5.2% |
| Chinese | 99.9 /100 | #19 | Exceptional 5.2% |
Demographics Similar to Syrians by Single Mother Households
In terms of single mother households, the demographic groups most similar to Syrians are French (6.0%, a difference of 0.070%), Tsimshian (6.0%, a difference of 0.17%), Immigrants from Egypt (6.0%, a difference of 0.22%), Icelander (6.0%, a difference of 0.23%), and Immigrants from Iraq (6.0%, a difference of 0.26%).
| Demographics | Rating | Rank | Single Mother Households |
| Albanians | 91.1 /100 | #132 | Exceptional 5.9% |
| Egyptians | 90.7 /100 | #133 | Exceptional 5.9% |
| Canadians | 90.5 /100 | #134 | Exceptional 5.9% |
| Immigrants | Saudi Arabia | 90.2 /100 | #135 | Exceptional 5.9% |
| Jordanians | 88.9 /100 | #136 | Excellent 6.0% |
| Immigrants | Pakistan | 88.4 /100 | #137 | Excellent 6.0% |
| Icelanders | 86.9 /100 | #138 | Excellent 6.0% |
| Syrians | 86.0 /100 | #139 | Excellent 6.0% |
| French | 85.7 /100 | #140 | Excellent 6.0% |
| Tsimshian | 85.2 /100 | #141 | Excellent 6.0% |
| Immigrants | Egypt | 85.0 /100 | #142 | Excellent 6.0% |
| Immigrants | Iraq | 84.8 /100 | #143 | Excellent 6.0% |
| Koreans | 84.4 /100 | #144 | Excellent 6.0% |
| Arabs | 84.0 /100 | #145 | Excellent 6.0% |
| French Canadians | 82.6 /100 | #146 | Excellent 6.0% |