Immigrants from Caribbean vs Immigrants from Taiwan Single Mother Households
COMPARE
Immigrants from Caribbean
Immigrants from Taiwan
Single Mother Households
Single Mother Households Comparison
Immigrants from Caribbean
Immigrants from Taiwan
8.4%
SINGLE MOTHER HOUSEHOLDS
0.0/ 100
METRIC RATING
325th/ 347
METRIC RANK
4.7%
SINGLE MOTHER HOUSEHOLDS
100.0/ 100
METRIC RATING
1st/ 347
METRIC RANK
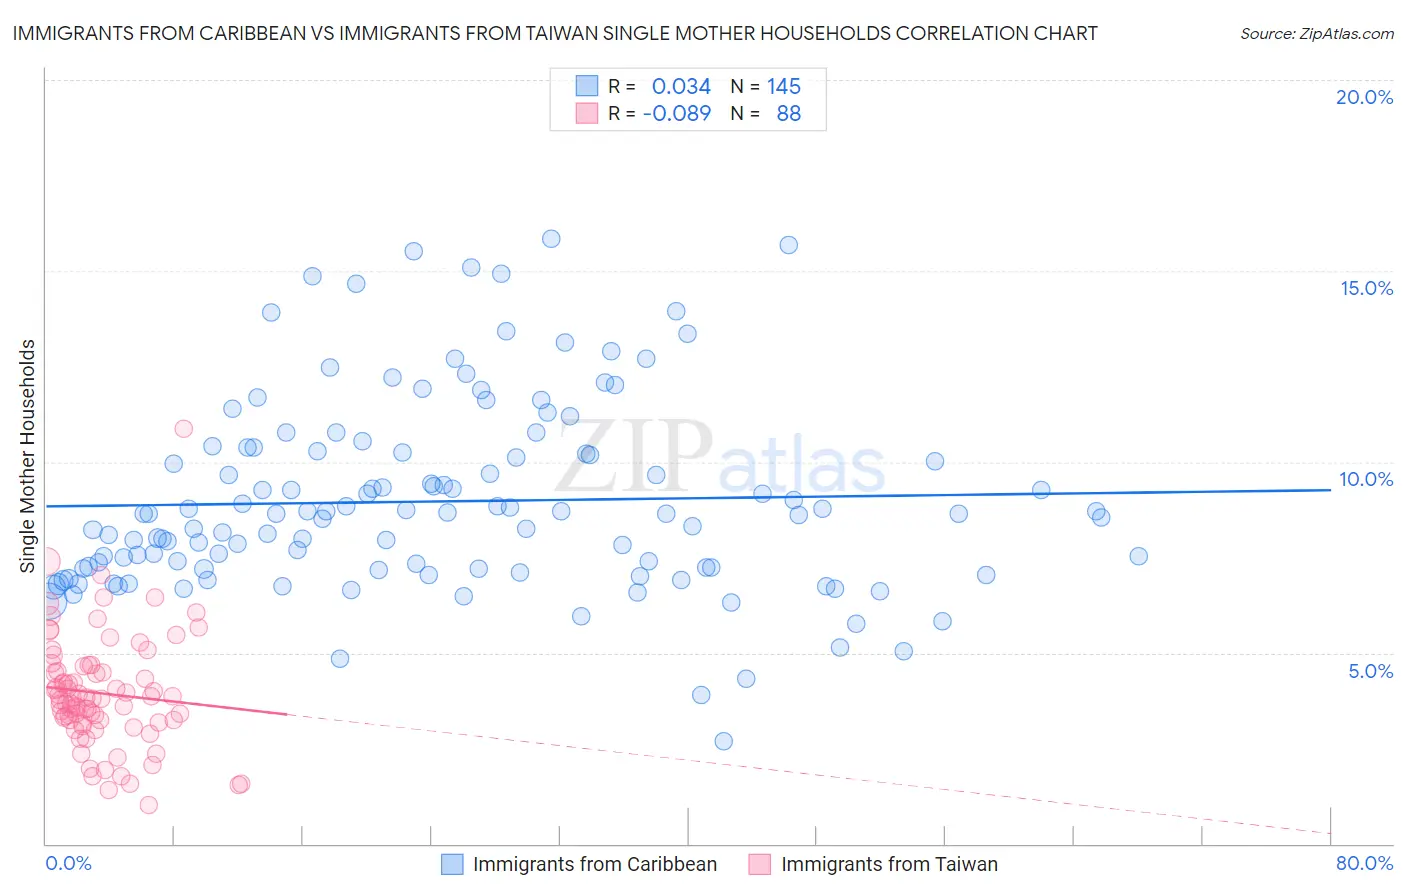
Immigrants from Caribbean vs Immigrants from Taiwan Single Mother Households Correlation Chart
The statistical analysis conducted on geographies consisting of 448,351,427 people shows no correlation between the proportion of Immigrants from Caribbean and percentage of single mother households in the United States with a correlation coefficient (R) of 0.034 and weighted average of 8.4%. Similarly, the statistical analysis conducted on geographies consisting of 297,635,593 people shows a slight negative correlation between the proportion of Immigrants from Taiwan and percentage of single mother households in the United States with a correlation coefficient (R) of -0.089 and weighted average of 4.7%, a difference of 78.8%.
Single Mother Households Correlation Summary
| Measurement | Immigrants from Caribbean | Immigrants from Taiwan |
| Minimum | 2.7% | 1.0% |
| Maximum | 15.8% | 10.9% |
| Range | 13.1% | 9.8% |
| Mean | 9.0% | 3.9% |
| Median | 8.6% | 3.8% |
| Interquartile 25% (IQ1) | 7.2% | 3.2% |
| Interquartile 75% (IQ3) | 10.3% | 4.6% |
| Interquartile Range (IQR) | 3.1% | 1.4% |
| Standard Deviation (Sample) | 2.5% | 1.5% |
| Standard Deviation (Population) | 2.5% | 1.5% |
Similar Demographics by Single Mother Households
Demographics Similar to Immigrants from Caribbean by Single Mother Households
In terms of single mother households, the demographic groups most similar to Immigrants from Caribbean are British West Indian (8.4%, a difference of 0.12%), Immigrants from Jamaica (8.4%, a difference of 0.18%), Immigrants from Haiti (8.4%, a difference of 0.27%), Yakama (8.4%, a difference of 0.45%), and Haitian (8.3%, a difference of 0.61%).
| Demographics | Rating | Rank | Single Mother Households |
| Senegalese | 0.0 /100 | #318 | Tragic 8.2% |
| Jamaicans | 0.0 /100 | #319 | Tragic 8.2% |
| Bahamians | 0.0 /100 | #320 | Tragic 8.3% |
| Immigrants | Senegal | 0.0 /100 | #321 | Tragic 8.3% |
| Pima | 0.0 /100 | #322 | Tragic 8.3% |
| Haitians | 0.0 /100 | #323 | Tragic 8.3% |
| Immigrants | Jamaica | 0.0 /100 | #324 | Tragic 8.4% |
| Immigrants | Caribbean | 0.0 /100 | #325 | Tragic 8.4% |
| British West Indians | 0.0 /100 | #326 | Tragic 8.4% |
| Immigrants | Haiti | 0.0 /100 | #327 | Tragic 8.4% |
| Yakama | 0.0 /100 | #328 | Tragic 8.4% |
| Hopi | 0.0 /100 | #329 | Tragic 8.5% |
| Inupiat | 0.0 /100 | #330 | Tragic 8.5% |
| Sioux | 0.0 /100 | #331 | Tragic 8.5% |
| U.S. Virgin Islanders | 0.0 /100 | #332 | Tragic 8.6% |
Demographics Similar to Immigrants from Taiwan by Single Mother Households
In terms of single mother households, the demographic groups most similar to Immigrants from Taiwan are Filipino (4.7%, a difference of 0.30%), Immigrants from Iran (4.8%, a difference of 2.6%), Assyrian/Chaldean/Syriac (4.8%, a difference of 2.7%), Immigrants from Hong Kong (4.8%, a difference of 3.3%), and Immigrants from Singapore (5.0%, a difference of 5.9%).
| Demographics | Rating | Rank | Single Mother Households |
| Immigrants | Taiwan | 100.0 /100 | #1 | Exceptional 4.7% |
| Filipinos | 100.0 /100 | #2 | Exceptional 4.7% |
| Immigrants | Iran | 100.0 /100 | #3 | Exceptional 4.8% |
| Assyrians/Chaldeans/Syriacs | 100.0 /100 | #4 | Exceptional 4.8% |
| Immigrants | Hong Kong | 100.0 /100 | #5 | Exceptional 4.8% |
| Immigrants | Singapore | 100.0 /100 | #6 | Exceptional 5.0% |
| Iranians | 100.0 /100 | #7 | Exceptional 5.0% |
| Immigrants | Ireland | 99.9 /100 | #8 | Exceptional 5.0% |
| Okinawans | 99.9 /100 | #9 | Exceptional 5.0% |
| Immigrants | Israel | 99.9 /100 | #10 | Exceptional 5.0% |
| Immigrants | China | 99.9 /100 | #11 | Exceptional 5.1% |
| Cypriots | 99.9 /100 | #12 | Exceptional 5.1% |
| Immigrants | India | 99.9 /100 | #13 | Exceptional 5.1% |
| Immigrants | Australia | 99.9 /100 | #14 | Exceptional 5.1% |
| Immigrants | Eastern Asia | 99.9 /100 | #15 | Exceptional 5.1% |