Cypriot vs Jamaican Single Mother Households
COMPARE
Cypriot
Jamaican
Single Mother Households
Single Mother Households Comparison
Cypriots
Jamaicans
5.1%
SINGLE MOTHER HOUSEHOLDS
99.9/ 100
METRIC RATING
12th/ 347
METRIC RANK
8.2%
SINGLE MOTHER HOUSEHOLDS
0.0/ 100
METRIC RATING
319th/ 347
METRIC RANK
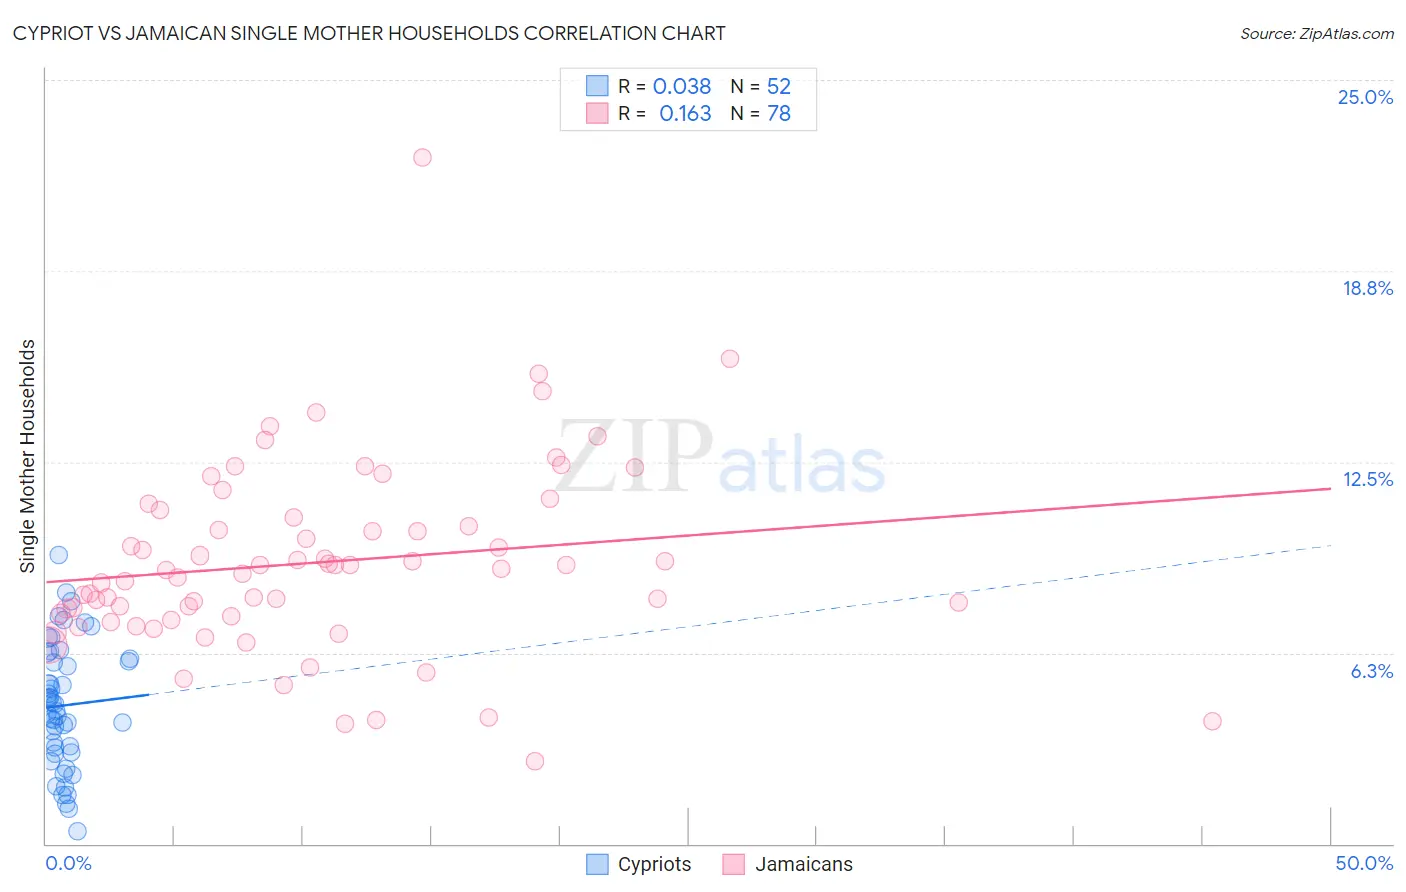
Cypriot vs Jamaican Single Mother Households Correlation Chart
The statistical analysis conducted on geographies consisting of 61,798,444 people shows no correlation between the proportion of Cypriots and percentage of single mother households in the United States with a correlation coefficient (R) of 0.038 and weighted average of 5.1%. Similarly, the statistical analysis conducted on geographies consisting of 367,100,383 people shows a poor positive correlation between the proportion of Jamaicans and percentage of single mother households in the United States with a correlation coefficient (R) of 0.163 and weighted average of 8.2%, a difference of 62.6%.
Single Mother Households Correlation Summary
| Measurement | Cypriot | Jamaican |
| Minimum | 0.41% | 2.7% |
| Maximum | 9.5% | 22.5% |
| Range | 9.0% | 19.8% |
| Mean | 4.5% | 9.2% |
| Median | 4.5% | 9.0% |
| Interquartile 25% (IQ1) | 3.1% | 7.4% |
| Interquartile 75% (IQ3) | 6.0% | 10.7% |
| Interquartile Range (IQR) | 2.9% | 3.2% |
| Standard Deviation (Sample) | 2.0% | 3.1% |
| Standard Deviation (Population) | 2.0% | 3.1% |
Similar Demographics by Single Mother Households
Demographics Similar to Cypriots by Single Mother Households
In terms of single mother households, the demographic groups most similar to Cypriots are Immigrants from India (5.1%, a difference of 0.12%), Immigrants from China (5.1%, a difference of 0.18%), Immigrants from Australia (5.1%, a difference of 0.45%), Immigrants from Eastern Asia (5.1%, a difference of 0.54%), and Indian (Asian) (5.1%, a difference of 0.73%).
| Demographics | Rating | Rank | Single Mother Households |
| Immigrants | Hong Kong | 100.0 /100 | #5 | Exceptional 4.8% |
| Immigrants | Singapore | 100.0 /100 | #6 | Exceptional 5.0% |
| Iranians | 100.0 /100 | #7 | Exceptional 5.0% |
| Immigrants | Ireland | 99.9 /100 | #8 | Exceptional 5.0% |
| Okinawans | 99.9 /100 | #9 | Exceptional 5.0% |
| Immigrants | Israel | 99.9 /100 | #10 | Exceptional 5.0% |
| Immigrants | China | 99.9 /100 | #11 | Exceptional 5.1% |
| Cypriots | 99.9 /100 | #12 | Exceptional 5.1% |
| Immigrants | India | 99.9 /100 | #13 | Exceptional 5.1% |
| Immigrants | Australia | 99.9 /100 | #14 | Exceptional 5.1% |
| Immigrants | Eastern Asia | 99.9 /100 | #15 | Exceptional 5.1% |
| Indians (Asian) | 99.9 /100 | #16 | Exceptional 5.1% |
| Soviet Union | 99.9 /100 | #17 | Exceptional 5.1% |
| Immigrants | Armenia | 99.9 /100 | #18 | Exceptional 5.2% |
| Chinese | 99.9 /100 | #19 | Exceptional 5.2% |
Demographics Similar to Jamaicans by Single Mother Households
In terms of single mother households, the demographic groups most similar to Jamaicans are Senegalese (8.2%, a difference of 0.11%), Bahamian (8.3%, a difference of 0.12%), Immigrants from Senegal (8.3%, a difference of 0.36%), Pima (8.3%, a difference of 0.44%), and Immigrants from Honduras (8.2%, a difference of 0.68%).
| Demographics | Rating | Rank | Single Mother Households |
| Bangladeshis | 0.0 /100 | #312 | Tragic 8.1% |
| Immigrants | Grenada | 0.0 /100 | #313 | Tragic 8.2% |
| Immigrants | Mexico | 0.0 /100 | #314 | Tragic 8.2% |
| Immigrants | Western Africa | 0.0 /100 | #315 | Tragic 8.2% |
| Africans | 0.0 /100 | #316 | Tragic 8.2% |
| Immigrants | Honduras | 0.0 /100 | #317 | Tragic 8.2% |
| Senegalese | 0.0 /100 | #318 | Tragic 8.2% |
| Jamaicans | 0.0 /100 | #319 | Tragic 8.2% |
| Bahamians | 0.0 /100 | #320 | Tragic 8.3% |
| Immigrants | Senegal | 0.0 /100 | #321 | Tragic 8.3% |
| Pima | 0.0 /100 | #322 | Tragic 8.3% |
| Haitians | 0.0 /100 | #323 | Tragic 8.3% |
| Immigrants | Jamaica | 0.0 /100 | #324 | Tragic 8.4% |
| Immigrants | Caribbean | 0.0 /100 | #325 | Tragic 8.4% |
| British West Indians | 0.0 /100 | #326 | Tragic 8.4% |