Cypriot vs Tohono O'odham Single Mother Households
COMPARE
Cypriot
Tohono O'odham
Single Mother Households
Single Mother Households Comparison
Cypriots
Tohono O'odham
5.1%
SINGLE MOTHER HOUSEHOLDS
99.9/ 100
METRIC RATING
12th/ 347
METRIC RANK
9.1%
SINGLE MOTHER HOUSEHOLDS
0.0/ 100
METRIC RATING
341st/ 347
METRIC RANK
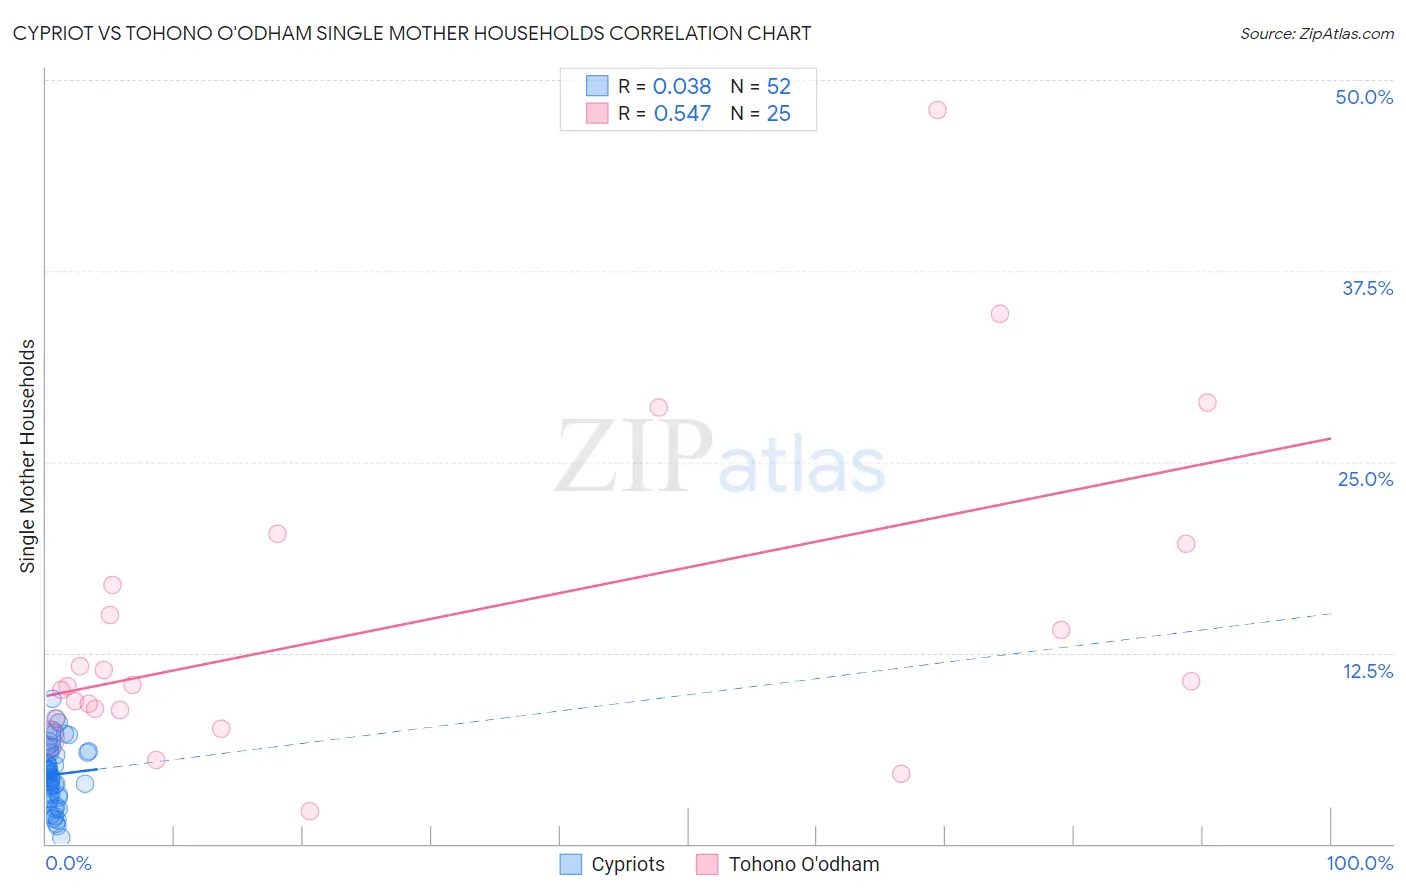
Cypriot vs Tohono O'odham Single Mother Households Correlation Chart
The statistical analysis conducted on geographies consisting of 61,798,444 people shows no correlation between the proportion of Cypriots and percentage of single mother households in the United States with a correlation coefficient (R) of 0.038 and weighted average of 5.1%. Similarly, the statistical analysis conducted on geographies consisting of 58,690,271 people shows a substantial positive correlation between the proportion of Tohono O'odham and percentage of single mother households in the United States with a correlation coefficient (R) of 0.547 and weighted average of 9.1%, a difference of 80.1%.
Single Mother Households Correlation Summary
| Measurement | Cypriot | Tohono O'odham |
| Minimum | 0.41% | 2.1% |
| Maximum | 9.5% | 48.0% |
| Range | 9.0% | 45.9% |
| Mean | 4.5% | 14.4% |
| Median | 4.5% | 10.4% |
| Interquartile 25% (IQ1) | 3.1% | 8.5% |
| Interquartile 75% (IQ3) | 6.0% | 18.3% |
| Interquartile Range (IQR) | 2.9% | 9.8% |
| Standard Deviation (Sample) | 2.0% | 10.6% |
| Standard Deviation (Population) | 2.0% | 10.4% |
Similar Demographics by Single Mother Households
Demographics Similar to Cypriots by Single Mother Households
In terms of single mother households, the demographic groups most similar to Cypriots are Immigrants from India (5.1%, a difference of 0.12%), Immigrants from China (5.1%, a difference of 0.18%), Immigrants from Australia (5.1%, a difference of 0.45%), Immigrants from Eastern Asia (5.1%, a difference of 0.54%), and Indian (Asian) (5.1%, a difference of 0.73%).
| Demographics | Rating | Rank | Single Mother Households |
| Immigrants | Hong Kong | 100.0 /100 | #5 | Exceptional 4.8% |
| Immigrants | Singapore | 100.0 /100 | #6 | Exceptional 5.0% |
| Iranians | 100.0 /100 | #7 | Exceptional 5.0% |
| Immigrants | Ireland | 99.9 /100 | #8 | Exceptional 5.0% |
| Okinawans | 99.9 /100 | #9 | Exceptional 5.0% |
| Immigrants | Israel | 99.9 /100 | #10 | Exceptional 5.0% |
| Immigrants | China | 99.9 /100 | #11 | Exceptional 5.1% |
| Cypriots | 99.9 /100 | #12 | Exceptional 5.1% |
| Immigrants | India | 99.9 /100 | #13 | Exceptional 5.1% |
| Immigrants | Australia | 99.9 /100 | #14 | Exceptional 5.1% |
| Immigrants | Eastern Asia | 99.9 /100 | #15 | Exceptional 5.1% |
| Indians (Asian) | 99.9 /100 | #16 | Exceptional 5.1% |
| Soviet Union | 99.9 /100 | #17 | Exceptional 5.1% |
| Immigrants | Armenia | 99.9 /100 | #18 | Exceptional 5.2% |
| Chinese | 99.9 /100 | #19 | Exceptional 5.2% |
Demographics Similar to Tohono O'odham by Single Mother Households
In terms of single mother households, the demographic groups most similar to Tohono O'odham are Menominee (9.2%, a difference of 0.32%), Lumbee (9.1%, a difference of 0.36%), Dominican (9.2%, a difference of 0.53%), Black/African American (9.0%, a difference of 1.6%), and Cape Verdean (8.9%, a difference of 3.2%).
| Demographics | Rating | Rank | Single Mother Households |
| Liberians | 0.0 /100 | #333 | Tragic 8.6% |
| Immigrants | Liberia | 0.0 /100 | #334 | Tragic 8.7% |
| Immigrants | Dominica | 0.0 /100 | #335 | Tragic 8.7% |
| Puerto Ricans | 0.0 /100 | #336 | Tragic 8.7% |
| Navajo | 0.0 /100 | #337 | Tragic 8.8% |
| Cape Verdeans | 0.0 /100 | #338 | Tragic 8.9% |
| Blacks/African Americans | 0.0 /100 | #339 | Tragic 9.0% |
| Lumbee | 0.0 /100 | #340 | Tragic 9.1% |
| Tohono O'odham | 0.0 /100 | #341 | Tragic 9.1% |
| Menominee | 0.0 /100 | #342 | Tragic 9.2% |
| Dominicans | 0.0 /100 | #343 | Tragic 9.2% |
| Immigrants | Dominican Republic | 0.0 /100 | #344 | Tragic 9.5% |
| Immigrants | Cabo Verde | 0.0 /100 | #345 | Tragic 9.6% |
| Yuman | 0.0 /100 | #346 | Tragic 9.6% |
| Yup'ik | 0.0 /100 | #347 | Tragic 10.0% |