Cypriot vs Mexican Single Mother Households
COMPARE
Cypriot
Mexican
Single Mother Households
Single Mother Households Comparison
Cypriots
Mexicans
5.1%
SINGLE MOTHER HOUSEHOLDS
99.9/ 100
METRIC RATING
12th/ 347
METRIC RANK
8.0%
SINGLE MOTHER HOUSEHOLDS
0.0/ 100
METRIC RATING
300th/ 347
METRIC RANK
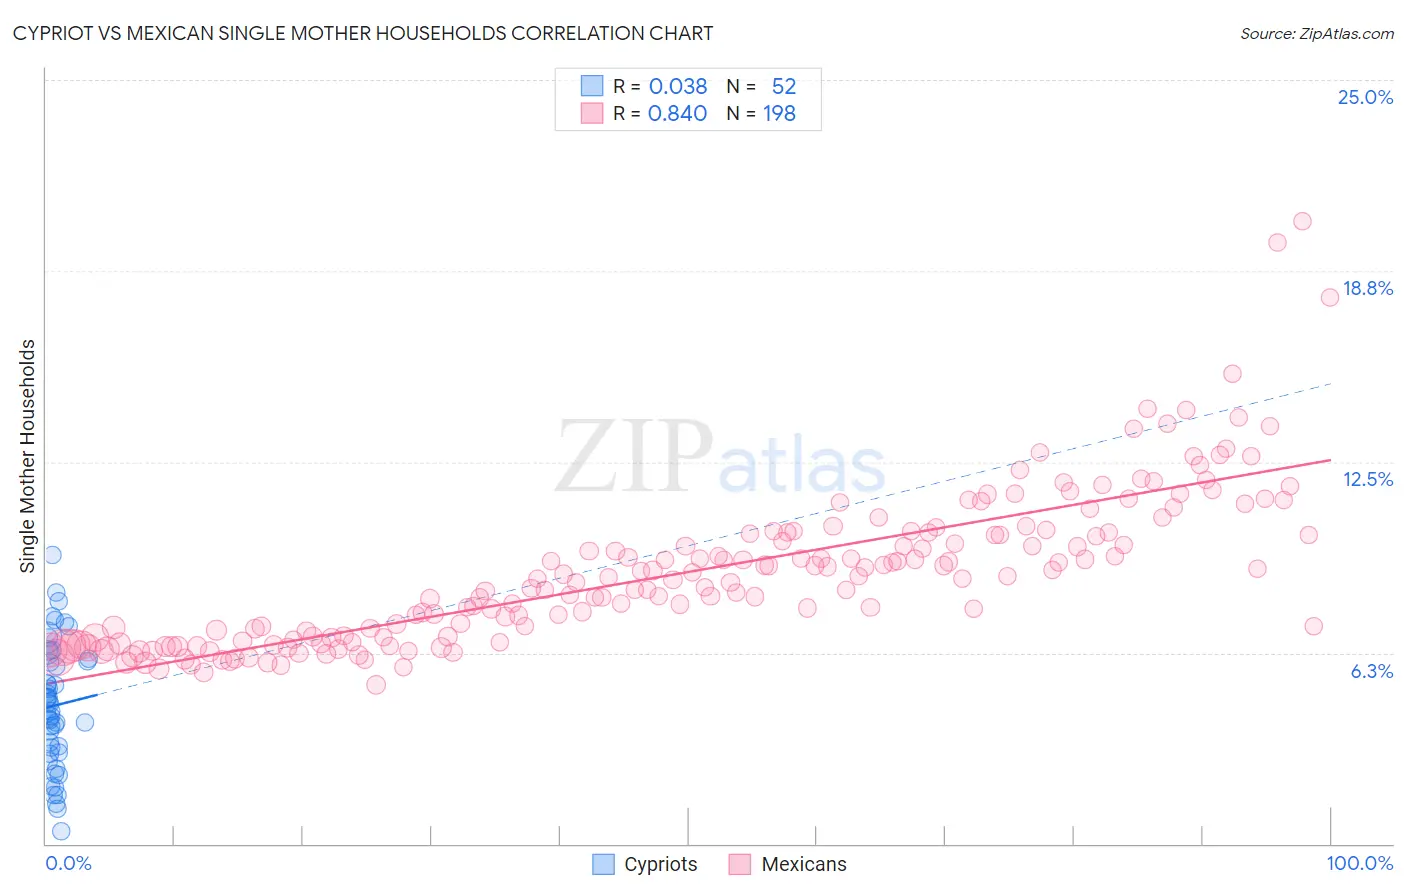
Cypriot vs Mexican Single Mother Households Correlation Chart
The statistical analysis conducted on geographies consisting of 61,798,444 people shows no correlation between the proportion of Cypriots and percentage of single mother households in the United States with a correlation coefficient (R) of 0.038 and weighted average of 5.1%. Similarly, the statistical analysis conducted on geographies consisting of 560,737,784 people shows a very strong positive correlation between the proportion of Mexicans and percentage of single mother households in the United States with a correlation coefficient (R) of 0.840 and weighted average of 8.0%, a difference of 57.1%.
Single Mother Households Correlation Summary
| Measurement | Cypriot | Mexican |
| Minimum | 0.41% | 5.2% |
| Maximum | 9.5% | 20.4% |
| Range | 9.0% | 15.2% |
| Mean | 4.5% | 8.9% |
| Median | 4.5% | 8.7% |
| Interquartile 25% (IQ1) | 3.1% | 6.8% |
| Interquartile 75% (IQ3) | 6.0% | 10.1% |
| Interquartile Range (IQR) | 2.9% | 3.4% |
| Standard Deviation (Sample) | 2.0% | 2.5% |
| Standard Deviation (Population) | 2.0% | 2.5% |
Similar Demographics by Single Mother Households
Demographics Similar to Cypriots by Single Mother Households
In terms of single mother households, the demographic groups most similar to Cypriots are Immigrants from India (5.1%, a difference of 0.12%), Immigrants from China (5.1%, a difference of 0.18%), Immigrants from Australia (5.1%, a difference of 0.45%), Immigrants from Eastern Asia (5.1%, a difference of 0.54%), and Indian (Asian) (5.1%, a difference of 0.73%).
| Demographics | Rating | Rank | Single Mother Households |
| Immigrants | Hong Kong | 100.0 /100 | #5 | Exceptional 4.8% |
| Immigrants | Singapore | 100.0 /100 | #6 | Exceptional 5.0% |
| Iranians | 100.0 /100 | #7 | Exceptional 5.0% |
| Immigrants | Ireland | 99.9 /100 | #8 | Exceptional 5.0% |
| Okinawans | 99.9 /100 | #9 | Exceptional 5.0% |
| Immigrants | Israel | 99.9 /100 | #10 | Exceptional 5.0% |
| Immigrants | China | 99.9 /100 | #11 | Exceptional 5.1% |
| Cypriots | 99.9 /100 | #12 | Exceptional 5.1% |
| Immigrants | India | 99.9 /100 | #13 | Exceptional 5.1% |
| Immigrants | Australia | 99.9 /100 | #14 | Exceptional 5.1% |
| Immigrants | Eastern Asia | 99.9 /100 | #15 | Exceptional 5.1% |
| Indians (Asian) | 99.9 /100 | #16 | Exceptional 5.1% |
| Soviet Union | 99.9 /100 | #17 | Exceptional 5.1% |
| Immigrants | Armenia | 99.9 /100 | #18 | Exceptional 5.2% |
| Chinese | 99.9 /100 | #19 | Exceptional 5.2% |
Demographics Similar to Mexicans by Single Mother Households
In terms of single mother households, the demographic groups most similar to Mexicans are Chippewa (8.0%, a difference of 0.16%), Immigrants from Ghana (8.0%, a difference of 0.25%), Immigrants from Bahamas (8.0%, a difference of 0.27%), Houma (7.9%, a difference of 0.46%), and Immigrants from West Indies (7.9%, a difference of 0.54%).
| Demographics | Rating | Rank | Single Mother Households |
| Immigrants | Cameroon | 0.0 /100 | #293 | Tragic 7.9% |
| Apache | 0.0 /100 | #294 | Tragic 7.9% |
| Barbadians | 0.0 /100 | #295 | Tragic 7.9% |
| Immigrants | Latin America | 0.0 /100 | #296 | Tragic 7.9% |
| Hispanics or Latinos | 0.0 /100 | #297 | Tragic 7.9% |
| Immigrants | West Indies | 0.0 /100 | #298 | Tragic 7.9% |
| Houma | 0.0 /100 | #299 | Tragic 7.9% |
| Mexicans | 0.0 /100 | #300 | Tragic 8.0% |
| Chippewa | 0.0 /100 | #301 | Tragic 8.0% |
| Immigrants | Ghana | 0.0 /100 | #302 | Tragic 8.0% |
| Immigrants | Bahamas | 0.0 /100 | #303 | Tragic 8.0% |
| Natives/Alaskans | 0.0 /100 | #304 | Tragic 8.0% |
| Colville | 0.0 /100 | #305 | Tragic 8.0% |
| Immigrants | Barbados | 0.0 /100 | #306 | Tragic 8.0% |
| Immigrants | St. Vincent and the Grenadines | 0.0 /100 | #307 | Tragic 8.0% |